Inversion of Marine Resistivity in a Karstic Estuary using Simultaneously...
advertisement

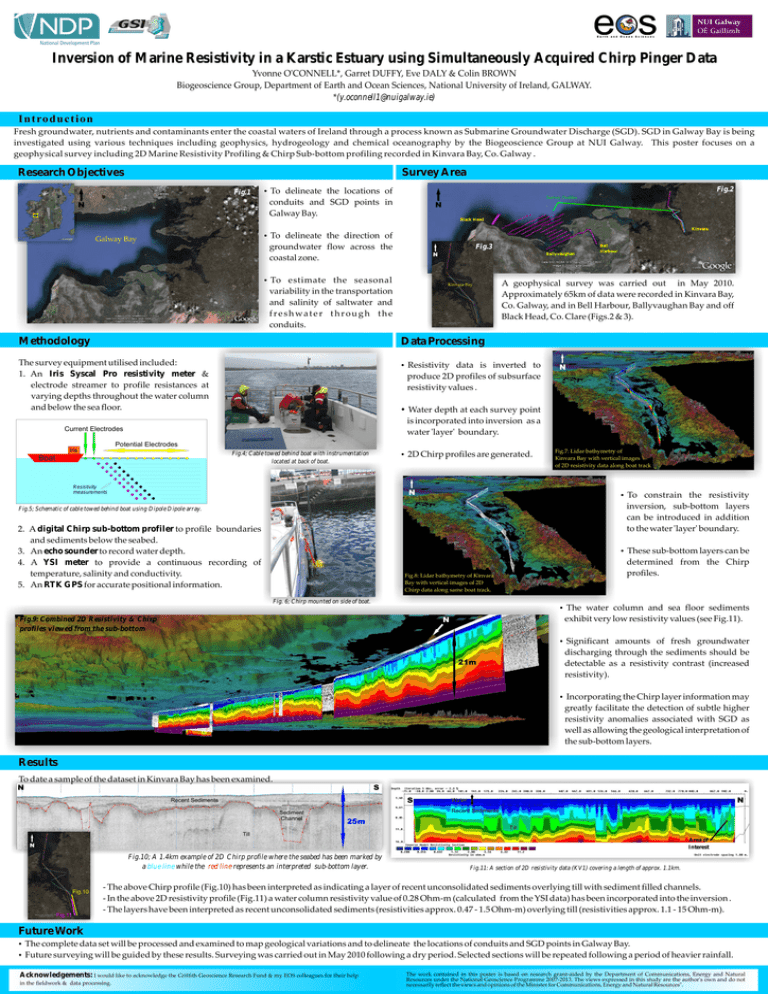
Inversion of Marine Resistivity in a Karstic Estuary using Simultaneously Acquired Chirp Pinger Data Yvonne O'CONNELL*, Garret DUFFY, Eve DALY & Colin BROWN Biogeoscience Group, Department of Earth and Ocean Sciences, National University of Ireland, GALWAY. *(y.oconnell1@nuigalway.ie) Introduction Fresh groundwater, nutrients and contaminants enter the coastal waters of Ireland through a process known as Submarine Groundwater Discharge (SGD). SGD in Galway Bay is being investigated using various techniques including geophysics, hydrogeology and chemical oceanography by the Biogeoscience Group at NUI Galway. This poster focuses on a geophysical survey including 2D Marine Resistivity Profiling & Chirp Sub-bottom profiling recorded in Kinvara Bay, Co. Galway . Survey Area Research Objectives Fig.1 Fig.2 ? To delineate the locations of Survey Profiles conduits and SGD points in Galway Bay. N N Black Head Kinvara ? To delineate the direction of Galway Bay groundwater flow across the coastal zone. Fig.3 Ballyvaughan N ? To estimate the seasonal Kinvara Bay variability in the transportation and salinity of saltwater and freshwater through the conduits. Bell Harbour A geophysical survey was carried out in May 2010. Approximately 65km of data were recorded in Kinvara Bay, Co. Galway, and in Bell Harbour, Ballyvaughan Bay and off Black Head, Co. Clare (Figs.2 & 3). Methodology Data Processing The survey equipment utilised included: 1. An Iris Syscal Pro resistivity meter & electrode streamer to profile resistances at varying depths throughout the water column and below the sea floor. ? Resistivity data is inverted to N produce 2D profiles of subsurface resistivity values . ? Water depth at each survey point is incorporated into inversion as a water 'layer' boundary. Current Electrodes Potential Electrodes Iris ? 2D Chirp profiles are generated. Fig.4; Cable towed behind boat with instrumentation located at back of boat. Boat Resistivity measurements N Fig.7: Lidar bathymetry of Kinvara Bay with vertical images of 2D resistivity data along boat track ? To constrain the resistivity inversion, sub-bottom layers can be introduced in addition to the water 'layer' boundary. Fig.5; Schematic of cable towed behind boat using Dipole Dipole array. 2. A digital Chirp sub-bottom profiler to profile boundaries and sediments below the seabed. 3. An echo sounder to record water depth. 4. A YSI meter to provide a continuous recording of temperature, salinity and conductivity. 5. An RTK GPS for accurate positional information. ? These sub-bottom layers can be determined from the Chirp profiles. Fig.8: Lidar bathymetry of Kinvara Bay with vertical images of 2D Chirp data along same boat track. Fig. 6; Chirp mounted on side of boat. The water column and sea floor sediments ? Fig.9: Combined 2D Resistivity & Chirp profiles viewed from the sub-bottom exhibit very low resistivity values (see Fig.11). N ? Significant amounts of fresh groundwater discharging through the sediments should be detectable as a resistivity contrast (increased resistivity). 21m ? Incorporating the Chirp layer information may greatly facilitate the detection of subtle higher resistivity anomalies associated with SGD as well as allowing the geological interpretation of the sub-bottom layers. Results To date a sample of the dataset in Kinvara Bay has been examined. N S S Recent Sediments Sediment Channel N Water Recent Sediments 25m Till Till Area of Interest N Fig.10; A 1.4km example of 2D Chirp profile where the seabed has been marked by a blue line while the red line represents an interpreted sub-bottom layer. Fig.10 Fig.11 Fig.11: A section of 2D resistivity data (KV1) covering a length of approx. 1.1km. - The above Chirp profile (Fig.10) has been interpreted as indicating a layer of recent unconsolidated sediments overlying till with sediment filled channels. - In the above 2D resistivity profile (Fig.11) a water column resistivity value of 0.28 Ohm-m (calculated from the YSI data) has been incorporated into the inversion . - The layers have been interpreted as recent unconsolidated sediments (resistivities approx. 0.47 - 1.5 Ohm-m) overlying till (resistivities approx. 1.1 - 15 Ohm-m). Future Work ? The complete data set will be processed and examined to map geological variations and to delineate the locations of conduits and SGD points in Galway Bay. ? Future surveying will be guided by these results. Surveying was carried out in May 2010 following a dry period. Selected sections will be repeated following a period of heavier rainfall. Acknowledgements: I would like to acknowledge the Griffith Geoscience Research Fund & my EOS colleagues for their help in the fieldwork & data processing. The work contained in this poster is based on research grant-aided by the Department of Communications, Energy and Natural Resources under the National Geoscience Programme 2007-2013. The views expressed in this study are the author's own and do not necessarily reflect the views and opinions of the Minister for Communications, Energy and Natural Resources".


