Document 14671456
advertisement
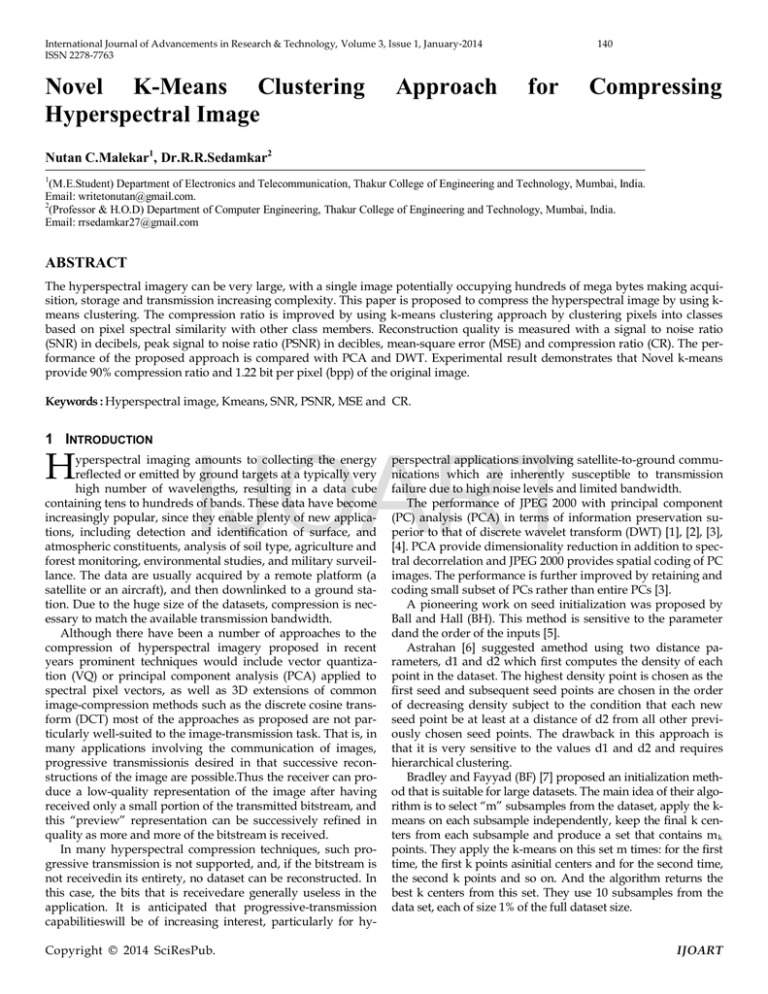
International Journal of Advancements in Research & Technology, Volume 3, Issue 1, January-2014 ISSN 2278-7763 Novel K-Means Clustering Hyperspectral Image Approach 140 for Compressing Nutan C.Malekar1, Dr.R.R.Sedamkar2 1 (M.E.Student) Department of Electronics and Telecommunication, Thakur College of Engineering and Technology, Mumbai, India. Email: writetonutan@gmail.com. 2 (Professor & H.O.D) Department of Computer Engineering, Thakur College of Engineering and Technology, Mumbai, India. Email: rrsedamkar27@gmail.com ABSTRACT The hyperspectral imagery can be very large, with a single image potentially occupying hundreds of mega bytes making acquisition, storage and transmission increasing complexity. This paper is proposed to compress the hyperspectral image by using kmeans clustering. The compression ratio is improved by using k-means clustering approach by clustering pixels into classes based on pixel spectral similarity with other class members. Reconstruction quality is measured with a signal to noise ratio (SNR) in decibels, peak signal to noise ratio (PSNR) in decibles, mean-square error (MSE) and compression ratio (CR). The performance of the proposed approach is compared with PCA and DWT. Experimental result demonstrates that Novel k-means provide 90% compression ratio and 1.22 bit per pixel (bpp) of the original image. Keywords : Hyperspectral image, Kmeans, SNR, PSNR, MSE and CR. 1 INTRODUCTION H IJOART yperspectral imaging amounts to collecting the energy reflected or emitted by ground targets at a typically very high number of wavelengths, resulting in a data cube containing tens to hundreds of bands. These data have become increasingly popular, since they enable plenty of new applications, including detection and identification of surface, and atmospheric constituents, analysis of soil type, agriculture and forest monitoring, environmental studies, and military surveillance. The data are usually acquired by a remote platform (a satellite or an aircraft), and then downlinked to a ground station. Due to the huge size of the datasets, compression is necessary to match the available transmission bandwidth. Although there have been a number of approaches to the compression of hyperspectral imagery proposed in recent years prominent techniques would include vector quantization (VQ) or principal component analysis (PCA) applied to spectral pixel vectors, as well as 3D extensions of common image-compression methods such as the discrete cosine transform (DCT) most of the approaches as proposed are not particularly well-suited to the image-transmission task. That is, in many applications involving the communication of images, progressive transmissionis desired in that successive reconstructions of the image are possible.Thus the receiver can produce a low-quality representation of the image after having received only a small portion of the transmitted bitstream, and this “preview” representation can be successively refined in quality as more and more of the bitstream is received. In many hyperspectral compression techniques, such progressive transmission is not supported, and, if the bitstream is not receivedin its entirety, no dataset can be reconstructed. In this case, the bits that is receivedare generally useless in the application. It is anticipated that progressive-transmission capabilitieswill be of increasing interest, particularly for hyCopyright © 2014 SciResPub. perspectral applications involving satellite-to-ground communications which are inherently susceptible to transmission failure due to high noise levels and limited bandwidth. The performance of JPEG 2000 with principal component (PC) analysis (PCA) in terms of information preservation superior to that of discrete wavelet transform (DWT) [1], [2], [3], [4]. PCA provide dimensionality reduction in addition to spectral decorrelation and JPEG 2000 provides spatial coding of PC images. The performance is further improved by retaining and coding small subset of PCs rather than entire PCs [3]. A pioneering work on seed initialization was proposed by Ball and Hall (BH). This method is sensitive to the parameter dand the order of the inputs [5]. Astrahan [6] suggested amethod using two distance parameters, d1 and d2 which first computes the density of each point in the dataset. The highest density point is chosen as the first seed and subsequent seed points are chosen in the order of decreasing density subject to the condition that each new seed point be at least at a distance of d2 from all other previously chosen seed points. The drawback in this approach is that it is very sensitive to the values d1 and d2 and requires hierarchical clustering. Bradley and Fayyad (BF) [7] proposed an initialization method that is suitable for large datasets. The main idea of their algorithm is to select “m” subsamples from the dataset, apply the kmeans on each subsample independently, keep the final k centers from each subsample and produce a set that contains m k points. They apply the k-means on this set m times: for the first time, the first k points asinitial centers and for the second time, the second k points and so on. And the algorithm returns the best k centers from this set. They use 10 subsamples from the data set, each of size 1% of the full dataset size. IJOART International Journal of Advancements in Research & Technology, Volume 3, Issue 1, January-2014 ISSN 2278-7763 Finally, a last round of k-means is performed on this dataset and the cluster centers of this round are returned as the initial seeds for the entire dataset. This method generally performs better than k-means and converges tothe local optimum faster. However, it still depends on the random choice of the subsamples and hence, can lead topoor clustering in an unlucky session. In this paper we propose a Novel K-means approach for hyperspectral image compression where seed selection for edge blocks (high variant blocks) and non-edge blocks (low variant blocks). The rest of paper is organized as follows: section 2 briefly describe various compression methods for hyperspectral image, section 3 presents proposed compression method, section 4 presents the performance analysis of the proposed method and section 5 concludes our work. 2 COMPRESSION TECHNIQUES PCA, a well-known technique in multivariate data analysis, has been widely used in the hyperspectral setting for spectral decorrelation as well as spectral dimensionality reduction. Capable of optimal decorrelation in a statistical sense, PCA often provides excellent decorrelation in practice. When all PCs are retained, PCA is commonly known as the Karhunen- Lo`eve transform (KLT), in which case a hyperspectral image with N spectral bands produces an N × N unitary KLT transform matrix. As this matrix is data dependent, it must be communicated to the decoder in any KLT-based compression system. Alternatively, PCA can effectuate dimensionality reduction by retaining in the KLT transform matrix only those eigenvectors corresponding to the P largest eigenvectors. The data volume passed to the encoder then has P < N, rather than N, spectral components, and the resulting N × P PCA matrix is communicated to the decoder[3]. The technique of PCA has found wide use in digital processing of hyperspectal images. PCA and image fusion techniques are often used to enhance an image particularly in the land-cover classification of satellite images, where such images are used for increasing the interpretability of human observer and for improving the accuracy of the classification. A 2D discretewavelet transform (DWT) can be implemented as a filter bank as illustrated in Fig. 1. This filter bank decomposes the original image into horizontal (H), vertical (V), diagonal (D), and baseband (B) subbands, each being onefourth the size of the original image. Wavelet theory provides filter-design methods such that the filter bank is perfectly reconstructing (i.e., there exists a reconstruction filter bank that will generate exactly the original image from the decomposed subbands H, V, D, and B), and such that the lowpass and highpass filters have finite impulse responses (which aids practical implementation). Multiple stages of decomposition can be cascaded together by recursively decomposing the baseband; the subbands in this case are usually arranged in a pyramidal form as illustrated in Fig.2. 141 Fig.1. One stage of 2D DWT decomposition composed of lowpass (LPF) and highpass (HPF) filters applied to the columns and rows independently. IJOART Copyright © 2014 SciResPub. Fig.2. A 3-scale, 2D DWT pyramid arrangement of subbands. The k-means algorithm is an algorithm to cluster objects based on attributes into k partitions. The objective is to minimize total intra-cluster variance, or the squared error function. V= ∑𝑘𝑖=1 ∑𝑋𝑗∈𝑆𝑖�𝑋𝑗 − 𝜇𝑖 � 2 (1) where there are k clusters S i , i = 1, 2,..., k and μ i is the centroid or mean point of all the points in cluster S i .The algorithm starts by partitioning the input points into k initial sets, either at random or using some heuristic data. It then calculates the centroid of each set and constructs a new partition by associating each point with the closest centroid. Then the centroids of each set are recalculated and the algorithm is repeated by alternate application of these two steps until convergence, which is obtained when the points no longer switch clusters (or alternatively centroids are no longer changed). Despite its efficiency, it has drawbacks like apriori fixation of number of clusters and random selection of initial seeds. Inappropriate choice of initial seeds may yield poor results and leads to increase in computation time for convergence. IJOART International Journal of Advancements in Research & Technology, Volume 3, Issue 1, January-2014 ISSN 2278-7763 142 3.1 Proposed Algorithm The hyperspectral image is divided into 4x4 vectors and the number of classes N should be set before the seed selection and pruning phases. The choice of N plays acrucial role in the performance of Novel K-means. 3.1.1 1. 2. 3. 4. 5. 6. 7. 8. Fig.3. Kmeans Flowchart 9. 10. 3 NOVEL KMEANS Centroid selection phase Load hyperspectral image. Initialize the dimension k. Initialize max_iterations. Initialize means to randomly selected colors of hyperspectral image. Calculate the nearest neighbor for every pixel in image. Calculate the means for every iteration as max_iterations. Find number of pixels clustered around nth mean. For every pixel in the image, calculate the nearest mean. Update the mean with new mean. For i=1 to row For j=1 to column • Calculate the nearest mean for the pixels in the image • Assign every pixel value's corresponding r, g and b values. • Find the difference between r,g.b values with mean value. • Find the euclidean distance. • Find minimum euclidean distance • Assign minimum euclidean distance as nearest mean. • Add the pixel to rgb values of its nearest mean. End End Calculate the new means for no of dimensions. • If pixels are assigned • Update the mean • End. Convergence Test Find how much means values are changing 2 2 d= ∑𝑁 𝑖=1,𝑗=1 �(𝑛𝑛𝑛 𝑚𝑚𝑚𝑚(𝑖, 𝑗)) − (𝑚𝑚𝑚𝑚(𝑖, 𝑗)) Where i≠j Update means with new-means IJOART Fig.3. Block Diagram of Novel Kmeans The proposed method is an innovative approach to enhance the performance of K-means algorithm. It adopts divide and conquer strategy by dividing the input dataspace into classes and apply K-means clustering. Novel K-means segments input image into K clusters and works intwo phases as follows. In the first phase, the input vectors are divided into N classes based on the mean value ofeach vector. A training vector is assigned to a class C I , if its mean value is less than or equal to the domain of C I . This mean based grouping of input data speeds up convergence resulting in reduction of computation time. K-Means algorithm is performed on each class of vectors with initial seeds. The number of initial seeds M in each class is proportional to its size. The initial seeds are selected with the right blend of statistical features (mean, no of pixels clustered around mean and mode parameter) of the class population. The hyperspectral dataset used, was generated by the SAMSON sensor. It covers the spectral range of 400nm-900nm with a band width of 3.2nm. The data was collected by the Florida Environmental Research Institute as part of the GOESR sponsored experiment. The image size is 952 X 952 X 156. Copyright © 2014 SciResPub. 11. 12. 13. 14. 15. 16. 3.1.2 Reconstruction of image 17. Calculate the euclidean distance between each of newly generated image and vectors in partial code book contructed. 18. Add only those vectors whose euclidean distance is minimum to codebook. 19. Repeat the processes for dimensions 20. Final code book resulting after step 19 is the initial code book for entire set. 21. Save Image IJOART International Journal of Advancements in Research & Technology, Volume 3, Issue 1, January-2014 ISSN 2278-7763 143 4 RESULTS AND DISCUSSION The software implementation of the algorithm is written in a Matlab environment using Matlab 7.10 software. The hyperspectral dataset used is generated by the SAMSON sensor. It covers the spectral range of 400nm-900nm with a bandwidth of 3.2nm. The data was collected by the Florida Environmental Research Institute as part of the GOES-R sponsored experiment. The instrument flown during the collect is the SAMSON, apush-broom, visible to near IR, hyperspectral sensor. This sensor was designed and developed by FERI [9]. They have 156 contiguous bands and 952X952 pixel resolution. In this paper it was decided to measure the performance with the following performance measures: Peak signal-to-noise ratio (PSNR): This is a commonly used quantitative fidelity criteria (in image processing applications). Let X i be the original pixel in spatial position of the spectral band b (of size N×M) and X I the respective reconstructed pixel, then for each spectral band 1 ≤ b ≤ 156, PSNR b is defined by MAXi² PSNR b = 10log 10 MSE (2) Where MAX i is the maximum possible pixel value of the image and MSE is the mean-square error measuring the deviation of the reconstructed image from the original image. MSE is defined by 1 IJOART M 2 MSE = NM ∑N x=1 ∑y=1[X i − X I ] (3) An average PSNR is obtained as the quality measure, where the averaging is performed over B spectral bands: �������= 1 ∑Bb=1 PSNRb PSNR B (B= 156 in our image) (b)PSNR of hyperspectral image at different wavelengths (4) (c) MSE of hyperspectral image at different wavelengths Fig.3. SNR, PSNR and MSE at different wavelength (400nm to 900nm) Table 1: SNR of hyperspectral image at different wavelengths Band No. SNR (in dB) DWT PCA Novel Kmeans Signal to noise ratio (SNR) in decibels, defined as the log ratio between the variance of the original data and the variance of the error. 69 10.0853 16.3288 12.3942 70 10.0869 16.3288 12.6384 Experimental results demonstrate that Novel Kmeans shows optimal performance interms of SNR, PSNR, MSE and Compression ratio. PSNR for DWT, PCA and Kmeans is 25.51dB, 37.84dB and 29.85 dB respectively. Compression ratio for kmeans is 90% which is higher than PCA (i.e 79.72%) and DWT (51.65%). Bit per pixel (BPP) is smallest for kmeans than PCA and DWT as shown in table 4. 75 10.0937 16.3288 12.0553 80 10.0937 16.3288 12.0553 85 10.0869 16.3288 12.6384 90 10.0869 16.3288 12.6384 95 10.0908 16.3288 12.1537 100 10.0908 16.3288 12.1537 105 10.0926 16.3288 12.1524 110 10.0937 16.3288 12.0553 115 10.0937 16.3288 12.0553 120 10.0869 16.3288 12.6384 125 10.0869 16.3288 12.6384 130 10.0937 16.3288 12.0553 135 10.0908 16.3288 12.1537 (a)SNR of hyperspectral image at different wavelengths Copyright © 2014 SciResPub. IJOART International Journal of Advancements in Research & Technology, Volume 3, Issue 1, January-2014 ISSN 2278-7763 140 10.0926 16.3288 12.1524 145 10.0972 16.3288 12.5635 150 10.0869 16.3288 12.6384 155 10.0902 16.3288 156 10.0937 16.3288 Band No. MSE DWT PCA Novel Kmeans 69 183.453 10.6864 65.0645 12.5905 70 183.3377 10.6864 58.5374 12.0553 75 182.808 10.6864 75.9497 80 182.808 10.6864 75.9497 85 183.3377 10.6864 58.5374 90 183.3377 10.6864 58.5374 95 183.0385 10.6864 72.5812 100 183.0385 10.6864 72.5812 105 182.8812 10.6864 72.6994 110 182.808 10.6864 75.9497 115 182.808 10.6864 75.9497 120 183.3377 10.6864 58.5374 Table 2: PSNR of hyperspectral image at different wavelengths Band No. 144 PSNR (in dB) DWT PCA Novel Kmeans 69 25.4956 37.8425 29.9974 70 25.4983 37.8425 30.4565 75 25.5109 37.8425 29.3255 80 25.5109 37.8425 29.3255 85 25.4983 37.8425 30.4565 90 25.4983 37.8425 30.4565 95 25.5054 37.8425 29.5226 100 25.5054 37.8425 29.5226 105 25.5091 37.8425 29.5155 110 25.5109 37.8425 29.3255 115 25.5109 37.8425 29.3255 120 25.4983 37.8425 30.4565 125 25.4983 37.8425 30.4565 130 25.5109 37.8425 29.3255 Table 4: 135 25.5054 37.8425 29.5226 Compression Ratio and BPP 140 25.5091 37.8425 29.5155 Compression Ratio BPP 145 25.5173 37.8425 30.3189 DWT 51.65% 6.05 150 25.4983 37.8425 30.4565 PCA 79.72% 2.54 155 25.505 37.8425 30.3683 Novel Kmeans 90.25% 1.22 156 25.5109 37.8425 29.3255 IJOART 4 Table 3: MSE of hyperspectral image at different wavelengths Copyright © 2014 SciResPub. 125 183.3377 10.6864 58.5374 130 182.808 10.6864 75.9497 135 183.0385 10.6864 72.5812 140 182.8812 10.6864 72.6994 145 182.5387 10.6864 60.4213 150 183.3377 10.6864 58.5374 155 183.0554 10.6864 59.7373 156 182.808 10.6864 75.9497 CONCLUSION In this paper, we have proposed a Novel kmeans clustering approach for hyperspectral image compression where selection of initial centroids depends on the statistical features of hyperspectral image (mean, no of pixels clustered around mean and mode parameter). The Novel Kmeans Clustering examined using SAMSON hyIJOART International Journal of Advancements in Research & Technology, Volume 3, Issue 1, January-2014 ISSN 2278-7763 145 perspectal sample data. The performance of these algorithms is evaluated based on PSNR of the compressed image, compression ratio, BPP and compared with DWT and PCA. For Novel Kmeans PSNR = 29.85 dB, CR = 90%, BPP = 1.22, for PCA PSNR = 37.84 dB, CR = 79.72%, BPP = 2.54 and for DWT PSNR = 25.51 dB, CR = 51.65%, BPP = 6.05. When band number changes its give variable results in terms of MSE, SNR and PSNR. Experimental results reveled that Novel Kmeans outperforms PCA and DWT in terms of compression ratio, bit per pixel (bpp). ACKNOWLEDGMENT I would like to express my gratitude to my project guide Prof. Dr. R.R Sedamkar for his supervision and continuous encouragement in my Master of Engineering programme. REFERENCES [1] [2] [3] [4] [5] [6] [7] [8] [9] J. E. Fowler and J. T. Rucker, “3-D wavelet-based compression of hyperspectral imagery,” in Hyperspectral Data Exploitation: Theory and Applications, C.-I. Chang, Ed. Hoboken, NJ: Wiley, 2007, ch. 14, pp. 379–407.W.-K. Chen, Linear Networks and Systems. Belmont, Calif.: Wadsworth, pp. 123-135, B. Penna, T. Tillo, E. Magli, and G. Olmo, “Transform coding techniques for lossy hyperspectral data compression,” IEEE Trans. Geosci. Remote Sens., vol. 45, no. 5, pp. 1408–1421, May 2007. Q. Du and J. E. Fowler, “Hyperspectral image compression using JPEG2000 and principal component analysis,” IEEE Geosci. RemoteSens. Lett., vol. 4, no. 2, pp. 201–205, Apr. 2007. W.Zhu, Q. Du, and J. E. Fowler, “Multitemporal Hyperspectral Image Compression”, IEEE Geoscience And Remote Sensing Letters,vol. 8, No. 3, May 2011. Ball, G.H. and D.J. Hall, 1967. PROMENADE-an online pattern recognition system, StanfordResearch Inst. Memo, Stanford University. Astrahan, M.M., 1970. Speech Analysis byClustering, or the Hyperphoneme Method, StanfordA. I. Project Memo, Stanford University. Fayyad, U.M., G. Piatetsky-Shapiro, P. Smyth and R.Uthurusamy, 1996. Advances in Knowledge Discovery and Data Mining. AAAI/MIT Press, ISBN: 0262560976, pp: 611. K. Somasundaram, M. Mary Shanthi Rani, “Novel K-means Algorithm for Compressing Images” International Journal of Computer Applications Volume 18– No.8, pp. 0975 – 8887, Mar. 2011. www.opticks.org/confluence/display/opticks/sample+data. IJOART Copyright © 2014 SciResPub. IJOART
