vii i ii
advertisement
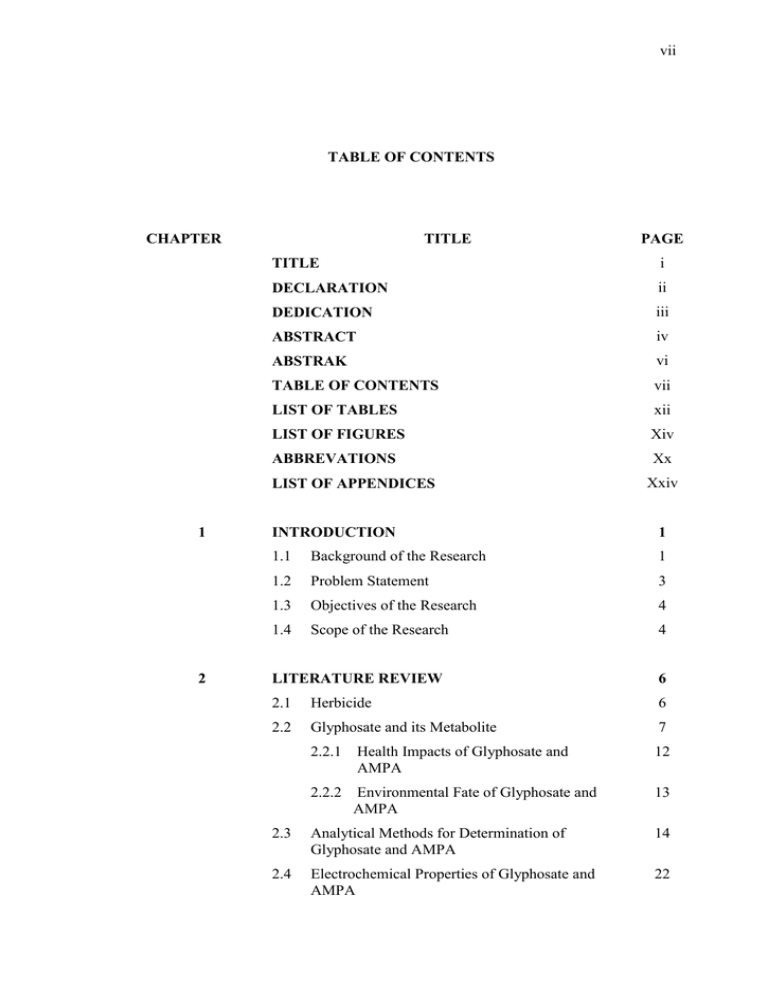
vii TABLE OF CONTENTS CHAPTER TITLE TITLE i DECLARATION ii DEDICATION iii ABSTRACT iv ABSTRAK vi TABLE OF CONTENTS vii LIST OF TABLES xii LIST OF FIGURES Xiv ABBREVATIONS Xx LIST OF APPENDICES 1 2 PAGE Xxiv INTRODUCTION 1 1.1 Background of the Research 1 1.2 Problem Statement 3 1.3 Objectives of the Research 4 1.4 Scope of the Research 4 LITERATURE REVIEW 6 2.1 Herbicide 6 2.2 Glyphosate and its Metabolite 7 2.2.1 Health Impacts of Glyphosate and AMPA 12 2.2.2 Environmental Fate of Glyphosate and AMPA 13 2.3 Analytical Methods for Determination of Glyphosate and AMPA 14 2.4 Electrochemical Properties of Glyphosate and AMPA 22 viii 2.5 Voltammetry Method 24 2.5.1 General Overview of Voltammetry Method 24 2.5.2 Voltammetric Measurement 27 2.5.1 27 2.5.3 3 Instrumentation Types of Volatmmetry Techniques 28 2.5.3.1 Cyclic Voltammetry (CV) 28 2.5.3.2 Differential Pulse Voltammetry (DPV) 31 2.5.3.3 Stripping Voltammetry (SV) 33 EXPERIMENTAL 35 3.1 Chemicals and Reagents 35 3.2 General Instruments 35 3.3 Preparation of Stock Solution 38 3.3.1 Glyphosate Solution (1000 ppm) 38 3.3.2 Aminomethylphosphonic Acid Solution (1000 ppm) 38 3.3.3 Phosphate Buffer, 0.1 M 38 3.3.4 Britton Robinson Buffer (BRB), 0.04 M 38 3.3.5 Sodium Hydroxide (NaOH), 0.1 M 39 3.3.6 Hydrochloric Acid (HCl), 0.1 M 39 3.3.7 Standard Copper (II) Solution (100 ppm) 39 3.3.8 Standard Zinc (II) Solution (100 ppm) 39 3.3.9 Standard Iron (II) Solution (100 ppm) 40 3.3.10 Real Samples 40 3.4 Fabrication of Copper Electrode 40 3.5 Analytical Technique for Voltammetry Analysis 41 3.5.1 General Procedures for Voltammetry Analysis 41 3.5.2 Cyclic Voltammetry Technique 41 3.5.2.1 Standard Addition Procedure in CV Study 41 3.5.2.2 Effect of Scan Rate (v) in CV Study 42 ix 3.5.3 Differential Pulse Voltammetry (DPV) Technique (Anodic and Cathodic Direction) 43 3.5.4 Optimization Study for Differential Pulse Voltammetry (DPV) Technique 43 3.5.4.1 Effect of Supporting Electrolyte in DPV Study 43 3.5.4.2 Effect of pH in DPV Study 43 3.5.4.3 Effect of Scan Rate (v) in DPV Study 44 3.5.4.4 Effect of Initial Potential (Ei) in DPV Study 44 3.5.4.5 Standard Addition Procedure in DPV Study 44 3.5.5 Differential Pulse Stripping Voltammetry (DPSV) Technique 45 3.5.6 Optimization Study for Differential Pulse Stripping Voltammetry (DPSV) Technique 45 3.5.6.1 Effect of Accumulation Potential in DPSV Study 46 3.5.6.2 Effect of Accumulation Time in DPSV Study 46 3.5.6.3 Standard Addition Procedure in DPSV Study 46 3.5.7 3.7 4 Interference Studies in DPSV Study 46 3.5.7.1 46 Effect of Zn(II) and Fe(II) 3.5.8 Validation Method 47 3.5.9 Application to Water Samples 47 Flow Chart 49 RESULTS AND DISCUSSION: DETERMINATION OF GLYPHOSATE AND AMINOMETHYLPHOSPHONIC ACID USING COPPER ELECTRODE 50 4.1 Introduction 50 4.2 Cyclic Voltammetry of Glyphosate (GLYP) and Aminomethylphosphonic Acid (AMPA) 51 x 4.3 Differential Pulse Voltammetry (DPV) of Glyphosate (GLYP) and Aminomethylphosphonic Acid (AMPA) 61 4.3.1 Optimization Studies for Differential Pulse Voltammetry 62 4.3.1.1 Effect of Supporting Electrolyte 62 4.3.1.2 Effect of pH Supporting Electrolyte 64 4.3.1.3 Effect of Scan Rate, v 66 4.3.1.4 Effect of Initial Potential, Ei 68 4.3.2 4.4 4.3.2.1 71 Calibration Curve of Glyphosate and AMPA using DPV 75 4.4.1 Optimization Studies for Differential Pulse Stripping Voltammetry 76 4.4.1.1 Effect of Accumulation Potential, Eacc 76 4.4.1.2 Effect of Accumulation Time, tacc 77 Analysis of Glyphosate and AMPA by Differential Pulse Cathodic Stripping Voltammetry (DPCSV) 78 4.4.2.1 79 4.4.3 5 70 Differential Pulse Stripping Voltammetry (DPSV) of Glyphosate (GLYP) and Aminomethylphosphonic Acid (AMPA) 4.4.2 4.5 Analysis of Glyphosate and AMPA by Differential Pulse Voltammetry (DPV) Calibration Curve of Glyphosate and AMPA Interference Studies 81 Determination of Glyphosate and AMPA in Mineral, Tap and River Water Using DPCSV 83 RESULTS AND DISCUSSION: DETERMINATION OF GLYPHOSATE AND AMINOMETHYLPHOSPHONIC ACID USING HANGING MERCURY DROP ELECTRODE 87 5.1 87 Cyclic Voltammetry of Glyphosate (GLYP) and Aminomethylphosphonic Acid (AMPA) xi 5.2 Differential Pulse Voltammetry (DPV) of Glyphosate (GLYP) and Aminomethylphosphonic Acid (AMPA) 95 5.2.1 Optimization Studies for Differential Pulse Voltammetry 5.2.1.1 Effect of Supporting Electrolyte 96 5.2.1.2 Effect of pH of Supporting Electrolyte 97 5.2.1.3 Effect of Scan Rate, v 98 5.2.1.4 Effect of Initial Potential, Ip 98 5.2.2 5.3 6 96 Analysis of Glyphosate and AMPA by Differential Pulse Voltammetry (DPV) 100 5.2.2.1 101 Calibration Curve of Glyphosate and AMPA using DPV Differential Pulse Stripping Voltammetry (DPSV) Studies of Glyphosate (GLYP) and Aminomethylphosphonic Acid (AMPA) 103 5.3.1 Optimization Studies for Differential Pulse Stripping Voltammetry 103 5.3.1.1 Effect of Accumulation Potential, Eacc 103 5.3.1.2 Effect of Accumulation Time, tacc 104 5.3.2 Calibration Curve of Glyphosate and AMPA using DPCSV 105 5.3.3 Interference Studies 107 5.4 Determination of Glyphosate and AMPA in Mineral, Tap and River Water Using DPCSV 109 5.5 Validation Method for Glyphosate and AMPA using Hanging Mercury Drop Electrode 113 CONCLUSION AND RECOMMENDATIONS 116 6.1 Conclusion 116 6.2 Recommendations 119 REFERENCES 120 Appendices A-B 129 xii LIST OF TABLES TABLE NO. TITLE PAGE 2.1 Physical Properties of Glyphosate and AMPA 9 2.2 Summary of Analytical Methods Used for the Determination of Glyphosate and AMPA in Various Samples 17 2.3 Value of Stability Constants for Cu(II) Complexes with Glyphosate, and AMPA 23 2.4 Excitation Signal Used In Voltammetry (Skoog et al., 2004) 25 2.5 Working Electrode and limit of detection (LOD) for Polarographic and Voltammetric Techniques (Barek et al., 2001) 26 2.6 The Characteristics of Reversible, Irreversible and Quasi-reversible System (Wang, 1994) 31 3.1 Standard Additions of Glyphosate and AMPA in Cyclic Voltammetry Technique using Copper Electrode 42 3.2 Standard Additions of Glyphosate and AMPA in Cyclic Voltammetry Technique using HMDE 42 4.1 The Reduction and Oxidation Potentials of Glyphosate and AMPA at Copper Electrode in 0.1 M in phosphate buffer at pH 6.4. Ei = 500 mV, Ef = -600 mV and v = 100 mV/s 55 4.2 The Slope Values for the Log Plot of Peak Current vs Scan Rate for Glyphosate and AMPA and Peak Separation of Glyphosate and AMPA at Copper Electrode in 0.1 M Phosphate Buffer at pH 6.4. Ei = + 500 mV and Ef = - 600 mV vs SCE, v = 100 mV/s 57 4.3 The Dependence of Peak Current of Glyphosate and AMPA to Their Concentrations Obtained by Cyclic Voltammetry inPhosphate Bufferat pH6.4. Ei = + 500 mV Ef = - 600 mV vs SCE and v = 100 mV/s 60 4.4 The Optimum Parameters of Glyphosate and AMPA using DPV 70 xiii 4.5 The Value Ip and Ep of Glyphosate and AMPA obtained by Optimized Parameters in Phosphate Buffer at pH 6.4 using DPV 70 4.6 The Summary of Calibration Results of Glyphosate and AMPA using DPV The Optimization Results of Glyphosate and AMPA using DPV The Optimum Parameters of Glyphosate and AMPA using DPCSV The Summary Results of Glyphosate and AMPA using DPCSV 75 4.10 Recovery of Glyphosate in Water Samples 83 4.11 Recovery of AMPA in Water Samples 85 4.12 Recovery of Glyphosate in Water Samples 84 4.13 Recovery of AMPA in Water Samples 86 4.14 Comparison of Glyphosate’s Recoveries in Water Samples 88 4.15 Comparison of AMPA’s Recoveries in Water Samples 88 5.1 The Reduction and Oxidation Potentials of Glyphosate and AMPA at HMDE in 0.1 M in phosphate buffer at pH 6.4. Ei = + 200 mV and Ef = - 300 mV vs Ag/AgCl and v = 100 mV/s and Slope Values for the Log Plot of Peak Current vs Scan Rate for Glyphosate and AMPA 89 5.2 Cyclic Voltammetry Peak Separation of Glyphosate and AMPA at HMDE in 0.1 M Phosphate Buffer at pH 6.4. Ei = + 500 mV and Ef = - 600 mV vs SCE, v = 100 mV/s 92 5.3 The Optimum Parameters of Glyphosate and AMPA using DPV 100 5.4 The Value Ip and Ep of Glyphosate and AMPA obtained by Optimized Parameters in Phosphate Buffer at pH 6.4 using DPV 100 5.5 The Summary of Calibration Results of Glyphosate and AMPA using DPV 101 5.6 The Summary Results of Glyphosate and AMPA using DPCSV 107 5.7 Recovery of Glyphosate in Water Samples 109 5.8 Recovery of AMPA in Water Samples 111 5.9 Comparison of Glyphosate’s Recoveries in Water Samples Comparison of AMPA’s Recoveries in Water Samples 114 4.7 4.8 4.9 5.10 76 78 81 114 xiv LIST OF FIGURES FIGURE NO. TITLE PAGE 1.1 Degradation Products of Glyphosate 2 2.1 Structure of Glyphosate 8 2.2 Structure of Aminomethylphosphonic Acid (AMPA) 8 2.3 Ionic Species of Glyphosate and their pKa Values 10 2.4 Diagram of Species Distribution with the Function of pH. a) Glyphosate and b) AMPA (Coutinho et al., 2009) 11 2.5 Glyphosate Degradation Pathway (Schuette, 1998) 12 2.6 An Electrochemical Cell Consists of Three Electrode System 27 2.7 Potential Waveform in Cyclic Voltammetry(Wang, 1994) 28 2.8 A Cyclic Voltammogram (O = Oxidation, R = Reduction) (Wang, 1994) 28 2.9 Cyclic Voltammograms of (a) Reversible, (b) Irreversible and (c) Quasi-reversible Reactions (ox = Oxidation Process and red = Reduction Process) (Fernandez, 2009) 30 2.10 Potential Wave Form for Differential Pulse Voltammetry (Wang, 1994) 32 2.11 A Differential Pulse Voltammogram (Wang, 1994) 33 2.12 Potential Wave Form of Anodic Stripping Voltammetry (Wang, 1994) 34 2.13 A Stripping Voltammogram (Zhi et al, 2010) 34 3.1 Eco-Tribo Polarography Analyzer Equipped with Polar Pro Version 1.0 Software 36 3.2 AD Instruments Power Lab (EDAQ) Analyzer Equipped with Echem Version 1.5 Software 37 3.3 Eco-Chemie B.V Autolab Analyzer Equipped with GPES Version 4.9.005 Software 37 3.4 Copper Working Electrode (A= copper wire, B= wire and C= connector) 40 xv 3.5 Flow chart of the study process 49 4.1 Influence of the Phosphate Buffer at Different pH on the Microelectrode Dissolution in the presence of 0.5 × 10⁻³ M Glyphosate (Coutinho et al., 2007a) 52 4.2 Cyclic Voltammogram of Glyphosate in Phosphate Buffer at pH 6.4. Glyphosate Concentration: a) 0, b) 2.96 × 10⁻⁶ M. Ei = + 500 mV and Ef = - 600 mV vs SCE and v = 100 mV/s 53 4.3 Cyclic Voltammogram of AMPA in Phosphate Buffer at pH 6.4. AMPA Concentration: a) 0, b) 9.01 × 10⁻⁶ M. Ei = + 500 mV and Ef = - 600 mV vs SCE and v = 100 mV/s 53 4.4 Proposed Structure of Cu(II) complex with Glyphosate and AMPA at pH 6.4 54 4.5 Cyclic Voltammograms at Copper Microelectrode in Phosphate Buffer. Solid Line: 0.25 mM Glyphosate; Dashed Line: 0 mM Glyphosate. v = 100 mV/s and Ei = -600 mV, (Coutinho et al., 2007c) 55 4.6 Cyclic Voltammogram of Glyphosate in Phosphate Buffer at pH 6.4 at Different Scan Rate. Glyphosate Concentration: 2.96 × 10⁻⁶ M. Ei = + 500 mV and Ef = - 600 mV vs SCE 56 4.7 Log plot of Peak Current vs Scan Rate for a) Oxidation Peak and b) Reduction Peak of Glyphosate. Ei = + 500 mV and Ef = - 600 mV vs SCE 57 4.8 Cyclic Voltammogram of Glyphosate in Phosphate Buffer at pH 6.4. Glyphosate Concentration: a) 0, b) 2.96 × 10⁻⁶ M, c) 5.92 × 10⁻⁶ M, d) 8.88 × 10⁻⁶ M, e) 1.18 × 10⁻⁵ M. Ei = + 500 mV Ef = - 600 mV vs SCE and v = 100 mV/s 58 4.9 Cyclic Voltammogram of AMPA in Phosphate Buffer at pH 6.4. AMPA Concentration: a) 0, b) 9.01 × 10⁻⁶ M, c)1.80 × 10⁻⁵ M, d) 2.70 × 10⁻⁵ M, e) 3.60 × 10⁻⁵ M. Ei = + 500 mV Ef = - 600 mV vs SCE and v = 100 mV/s 59 4.10 Peak Current of a) Oxidation Peak and b) Reduction Peak of Glyphosate with increasing concentration of Glyphosate. Ei = + 500 mV Ef = - 600 mV vs SCE and v = 100 mV/s Voltammogram of Glyphosate, 1.18 × 10⁻⁶ M in Phosphate Buffer at Variation of pH. Ei = 100 mV, Ef = - 300 mV, v = 100 mV/s, Cathodic Direction 59 Ip versus Type of Supporting Electrolyte at pH 6.4 of a) Glyphosate, 1.18 × 10⁻⁶ M and b) AMPA, 7.20 × 10⁻⁶ M. Ei = - 600 mV, Ef = 600 mV, v = 100 mV/s, Anodic Direction 63 4.11 4.12 61 xvi 4.13 Ip versus Type of Supporting Electrolyte at pH 6.4 of a) Glyphosate, 1.18 × 10⁻⁶ M and b) AMPA, 7.20 × 10⁻⁶ M. Ei = 100 mV, Ef = -300 mV, v = 100 mV/s, Cathodic Direction 63 4.14 Ip and Ep versus pH of a) Glyphosate, 1.18 × 10⁻⁶ M and b) AMPA, 7.20 × 10⁻⁶ M in 0.1 M Phosphate Buffer. Ei = -600 mV, Ef = 600 mV, v = 100 mV/s, Anodic Direction 65 4.15 Ip and Ep versus pH of a) Glyphosate, 1.18 × 10⁻⁶ M and b) AMPA, 7.20 × 10⁻⁶ M in 0.1 M Phosphate Buffer. Ei = 100 mV, Ef = -300 mV, v = 100 mV/s, Cathodic Direction 65 4.16 Ip and Ep versus scan rate of a) Glyphosate, 1.18 × 10⁻⁶ M and b) AMPA, 7.20 × 10⁻⁶ M in 0.1 M Phosphate Buffer at pH 6.4, Ei = -600 mV and Ef = 600 mV, Anodic Direction 67 4.17 Ip and Ep versus scan rate of a) Glyphosate, 1.18 × 10⁻⁶ M and b) AMPA, 7.20 × 10⁻⁶ M in 0.1 M Phosphate Buffer at pH 6.4, Ei = 100 mV, Ef = - 300 mV, Cathodic Direction 67 4.18 Ip and Ep versus Initial Potential of a) Glyphosate, 1.18 × 10⁻⁶ M and b) AMPA, 7.20 × 10⁻⁶ M in 0.1 M Phosphate Buffer at pH 6.4, Ef = 600 mV and v = 80 mV/s, Anodic Direction 69 4.19 Ip and Ep versus Initial Potential of a) Glyphosate, 1.18 × 10⁻⁶ M and b) AMPA, 7.20 × 10⁻⁶ M in 0.1 M Phosphate Buffer at pH 6.4.Ef = - 300 Mv and v = 100 mV/s, Cathodic Direction 69 4.20 DP Voltammogram by Anodic Direction of a) Glyphosate and b) AMPA in Phosphate Buffer at pH 6.4. Ei = -600/ -700 mV, Ef = 600 mV and v = 80 mV/s 72 4.21 DP Voltammogram by Cathodic Direction of a) Glyphosate and b) AMPA in Phosphate Buffer at pH 6.4. Ei = 600/ 800 mV, Ef = - 350 mV and v = 100 mV/s 73 4.22 Linear Plot of a) Glyphosate and b) AMPA in Phosphate Buffer at pH 6.4 using DPV, Anodic Direction 74 4.23 Linear Plot of a) Glyphosate and b) AMPA in Phosphate Buffer at pH 6.4 using DPV, Cathodic Direction 74 4.24 Ip versus Accumulation Potential of a) Glyphosate, 1.18 × 10⁻⁶ M and b) AMPA, 7.20 × 10⁻⁶ M in 0.1 M Phosphate Buffer at pH 6.4. Ei = 600/800 mV, Ef = - 500 mV and v = 100 mV/s 77 xvii 4.25 Ip versus Accumulation Time of a) Glyphosate, 1.18 × 10⁻⁶ M and b) AMPA, 7.20 × 10⁻⁶ M in 0.1 M Phosphate Buffer at pH 6.4. Ei = 600/800 mV, Ef = -500 mV, v = 80 mV/s and Eacc = -500/-600 mV 78 4.26 DPCS Voltammogram of a) Glyphosate and b) AMPA in Phosphate Buffer at pH 6.4. Ei = 600/ 800 mV, Ef = -500 mV v = 100 mV/s, Eacc = 500 mV and tacc = 10/20 s 80 4.27 Linear Plot of a) Glyphosate b) AMPA in Phosphate Buffer at pH 6.4 using DPCSV 81 4.28 The Graph of Ipof a) Glyphosate and b) AMPA with Increasing Concentration of Fe2+ and Zn2+ ion in Phosphate Buffer at pH 6.4 using DPCSV 82 4.29 DPCS Voltammogram with Added 0.5 ppm Glyphosate in a) Mineral Water, b) Tap Water and c) River Water in Phosphate Buffer at pH 6.4 84 4.30 DPCS Voltammogram with Added 2 ppm AMPA in a) Mineral Water, b) Tap Water and c) River Water in Phosphate Buffer at pH 6.4 86 5.1 Cyclic Voltammogram of Glyphosate in 0.1 M Phosphate Buffer at pH 6.4. Glyphosate Concentration: a) 0, b) 5.92 × 10⁻⁷ M. Ei = + 200 mV and Ef = - 300 mV vs Ag/AgCl and v = 100 mV/s. Cu2+ = 7.11 × 10⁻⁵ M 88 5.2 Cyclic Voltammogram of AMPA in 0.1 M Phosphate Buffer at pH 6.4. AMPA Concentration: a) 0, b) 2.25× 10⁻⁶ M. Ei = + 200 mV and Ef = - 300 mV vs Ag/AgCl and v = 100 mV/s. Cu2+ = 7.11 × 10⁻⁵ M 88 5.3 Cyclic Voltammogram of Glyphosate in Phosphate Buffer at pH 6.4 at Different Scan Rate. Glyphosate Concentration: 5.92 × 10⁻⁷ M. Ei = + 200 mV and Ef = - 300 mV vs Ag/AgCl 90 5.4 Cyclic Voltammogram of AMPA in Phosphate Buffer at pH 6.4 at Different Scan Rate. AMPA Concentration: 2.25 × 10⁻⁶ M. Ei = + 200 mV and Ef = - 300 mV vs Ag/AgCl 90 5.5. Log plot of Peak Current vs Scan Rate for a) Oxidation Peak and b) Reduction Peak of Glyphosate. Ei = + 200 mV and Ef = - 300 mV vs Ag/AgCl 91 5.6 Log plot of Peak Current vs Scan Rate for a) Oxidation Peak and b) Reduction Peak of AMPA. Ei = + 200 mV and Ef = - 300 mV vs Ag/AgCl 91 xviii 5.7 Cyclic Voltammogram of Glyphosate in Phosphate Buffer at pH 6.4. Glyphosate Concentration: a) 0, b) 5.92 × 10⁻⁷ M, c)1.18 × 10⁻⁶ M, d) 1.78 × 10⁻⁶ M, e) 2.37 × 10⁻⁶ M. Ei = + 200 mV and Ef = - 300 mV vs Ag/AgCl and v = 100 mV/s. Cu2+ = 7.11 × 10⁻⁵ M 93 5.8 Cyclic Voltammogram of AMPA in Phosphate Buffer at pH 6.4. AMPA Concentration: a) 0, b) 2.25 × 10⁻⁶ M, c) 4.50 × 10⁻⁵ M, d) 6.75 × 10⁻⁵ M, e) 9.01 × 10⁻⁶ M. Ei = + 200 mV and Ef = - 300 mV vs Ag/AgCl and v = 100 mV/s. Cu2+ = 7.11 × 10⁻⁵ M 93 5.9 Peak Current of Reduction Peak of a) Glyphosate and b) AMPA with Increasing Concentration. Ei = + 200 mV and Ef = - 300 mV vs Ag/AgCl and v = 100 mV/s 94 5.10 Voltammogram of Glyphosate, 2.96 × 10⁻⁷ M in Phosphate Buffer at Variation of pH. Ei = + 200 mV, Ef = - 300 mV, v = 100 mV/s 95 5.11 Ip versus Type of Supporting Electrolyte at pH 6.4 of a) Glyphosate, 2.96 × 10⁻⁷ M and b) AMPA, 1.35 × 10⁻⁶ M. Ei = + 200 mV, Ef = -300 mV, v = 100 mV/s 96 5.12 Ip and Ep versus pH of 0.1 M Phosphate Buffer of a) Glyphosate, 2.96 × 10⁻⁷ M and b) AMPA, 1.35 × 10⁻⁶ M. Ei = + 200 mV, Ef = -300 mV, v = 100 mV/s 97 5.13 Ip and Ep versus scan rate of a) Glyphosate, 2.96 × 10⁻⁷ M and b) AMPA, 1.35 × 10⁻⁶ M. Ei = + 200 mV, Ef = -300 mV 98 5.14 Ip and Ep versus Initial Potential of a) Glyphosate, 2.96 × 10⁻⁷ M and b) AMPA, 1.35 × 10⁻⁶ M. Ef = - 300 mV, v = 100 mV/s 99 5.15 Linear Plot of a) Glyphosate and b) AMPA in Phosphate Buffer at pH 6.4 using DPV 101 5.16 DP Voltammogram of a) Glyphosate and b) AMPA in Phosphate Buffer at pH 6.4. Ei = + 210/200 mV, Ef = -300 mV, v = 100 mV/s 102 5.17 Ip versus Accumulation Potential of a) Glyphosate, 2.96 × 10⁻⁷ M and b) AMPA, 1.35 × 10⁻⁶ M in 0.1 M Phosphate Buffer at pH 6.4. Ei = + 210/200 mV, Ef = -350 mV and v = 100 mV/s 104 5.18 Ip versus Accumulation Time of a) Glyphosate, 2.96 × 10⁻⁷ M and b) AMPA, 1.35 × 10⁻⁶ M in 0.1 M Phosphate Buffer at pH 6.4. Ei = + 210/200 mV, Ef = -350 mV and v = 100 mV/s and Eacc = 200 mV 105 xix 5.19 DPCS Voltammogram of a) Glyphosate and b) AMPA in Phosphate Buffer at pH 6.4. Ei = + 210/200 mV, Ef = - 350 mV v = 100 mV/s, Eacc = 200 mV and tacc = 20/30 s 106 5.20 Linear Plot of a) Glyphosate b) AMPA in Phosphate Buffer at pH 6.4 using DPCS 107 5.21 The Graph of Ip of a) Glyphosate and b) AMPA with Increasing Concentration of Fe2+ and Zn2+ ion in Phosphate Buffer at pH 6.4 using DPCSV 108 5.22 DPCS Voltammogram with Added 0.17 ppm Glyphosate in a) Mineral Water, b) Tap Water and c) River Water in Phosphate Buffer at pH 6.4 110 5.23 DPCS Voltammogram with Added 0.5 ppm AMPA in a) Mineral Water, b) Tap Water and c) River Water in Phosphate Buffer at pH 6.4 112 5.24 Linear Plot of a) Glyphosate b) AMPA in Phosphate Buffer at pH 6.4 using DPCSV by HMDE 114 5.25 DPCS Voltammogram of a) Glyphosate and b) AMPA in Phosphate Buffer at pH 6.4 using HMDE. Ei = + 210/ 200 mV, Ef = - 300 mV, v = 100 mV/s, Eacc = 200 mV and tacc = 20/30 s 115 A-1 Cyclic Voltammogram of AMPA in Phosphate Buffer at pH 6.4at Different Scan Rate. AMPA Concentration: 9.01 × 10⁻⁶ M. Ei = + 500 mV and Ef = - 600 mV vs SCE 129 A-2 Peak Current of a) Oxidation Peak and b) Reduction Peak of AMPA with Increasing Scan Rate of AMPA. Ei = + 500 mV and Ef = - 600 mV vs SCE 129 B-1 Peak Current of a) Oxidation Peak and b) Reduction Peak of AMPA with Increasing Concentration of AMPA using CV. Ei = + 500 mV and Ef = - 600 mV vs SCE, v = 100 mV/s 130 xx ABBREVATIONS % - Percent µm - Micrometer µgL-1 - Microgram per Liter 2,4-D - 2,4-dichlorophenoxyacetic acid Ag/AgCl - Silver/Silver Chloride Al(NO3)3 - Aluminium Nitrate ACP - Alternate Current Polarography ACV - Alternate Current Voltammetry AMPA - Aminomethylphosphonic Acid ASV - Anodic Stripping Voltammetry BRB - Britton-Robinson Buffer CD - Coulometric Detector CE - Capillary Electrophoresis CGS - Capillary Gas Chromatography C3H8NO5P - Glyphosate CH3COOH - Glacial Acetic Acid CH6NO3P - Aminomethylphosphonic Acid CNLSD - Condensation Nucleation Light Scattering Detection CSV - Cathodic Stripping Voltammetry CuE Copper Electrode CV - Cyclic Voltammetry DME - Dropping Mercury Electrode DPASV - Differential Pulse Anodic Stripping Voltammetry DPP - Differential Pulse Polarography DPV - Differential Pulse Voltammetry Eacc - Accumulation Potential Ei - Initial Potential Ef Final Potential xxi ECD - Electron Capture Detector EI-MS - Electron Impact Mass Spectrometry ES-MS - Electrospray Mass Spectrometry ESI-MS - Electrospray Ionization Mass Spectrometry ELISA - Enzyme-Linked Immunosorbant Assays EPA - Environmental Protection Agency EPSPS - 5-enolpyruvylshikimate-3-phosphatesynthase FD - Fluorescence Detection FMOC-CI - 9-fluorenyl-methyloxycarbonyl chloroformate FPD - Flame Photometric Detector g - Gram GC - Gas Chromatography GLYP - Glyphosate H3BO3 - Boric Acid HCl - Hydrochloric Acid H3PO4 - Orthophosphoric Acid HILIC - Hydrophilic Interaction Chromatography HMDE - Hanging Mercury Dropping Electrode HPIC-ICP-DRC-MS- High Performance Ion Chromatography coupled to Inductively Coupled Plasma Dynamic Reaction Cell Mass Spectrometry HPLC - High Performance Liquid Chromatography HPR - Horseradish Peroxidase Ip - Peak Current IC - Ion Chromatography ICP-MS - Inductive Coupled Plasma Mass Spectrometry IMAC - Immobilized Metal Ion Affinity IT-MS - Ion Trap Mass Spectrometry Ka Acid Dissociation Constant KCl - Potassium Chloride KH2PO4 - Potassium Dihydrogen Phosphate KNO3 - Potassium Nitrate LC - Liquid Chromatography L’ELISA - Linker Enzyme Linked Immunosorbant Assay xxii LOD - Limit of Detection LOQ - Limit of Quantification LQ - Liquid Chromatography M - Molar mL - Milliliter Mv/s - Milivolt per Second MS - Mass Chromatography N2 - Nitrogen Gas NaCl - Sodium Chloride Na2HPO4 - Disodium Hydrogen Phosphate NaOH - Sodium Hydroxide NPD - Nitrogen Phosphorus Detector NPP - Normal Pulse Polarography NPV - Normal Pulse Voltammetry ng ml-1 - Nanogram per Mililiter Ni(NO3)2 Nickel Nitrate NiAl-NO3-LDH Nickel Aluminium Nitrate Layered Double Hydroxide OPA-MERC - o-phthaldehyde-mercaptoethanol pKa - log10Ka p-value Probability value POEA - Polyoxyethylene Amine PBS - Phosphate buffer saline ppm - Part per Million PF-PD - Pulsed Flame Photometric Detector R2 - Correlation Coefficient SCE - Saturated Calomel Electrode SCV - Stair Case Voltammetry SME - Supported Liquid Membrane SPE - Solid Phase Extraction SPE - Screen Printed Electrode SWP - Square Wave Polarography SWV - Square Wave Voltammetry SWSV - Square Wave Stripping Voltammetry TFAA - Trifluoroacetic Anhydride xxiii TFE - Trifluoroethanol tacc - Accumulation Time UME - Ultramicroelectrode US - United State UVD - Ultraviolet Detector υ - Scan Rate xxiv LIST OF APPENDICES APPENDIX TITLE PAGE A Cyclic voltammogram of AMPA on the effect of scan rate and the dependence of peak current of AMPA on their scan rate 129 B Dependence of the peak current of AMPA on their concentrations using CV 130
