8.5 Solution
advertisement

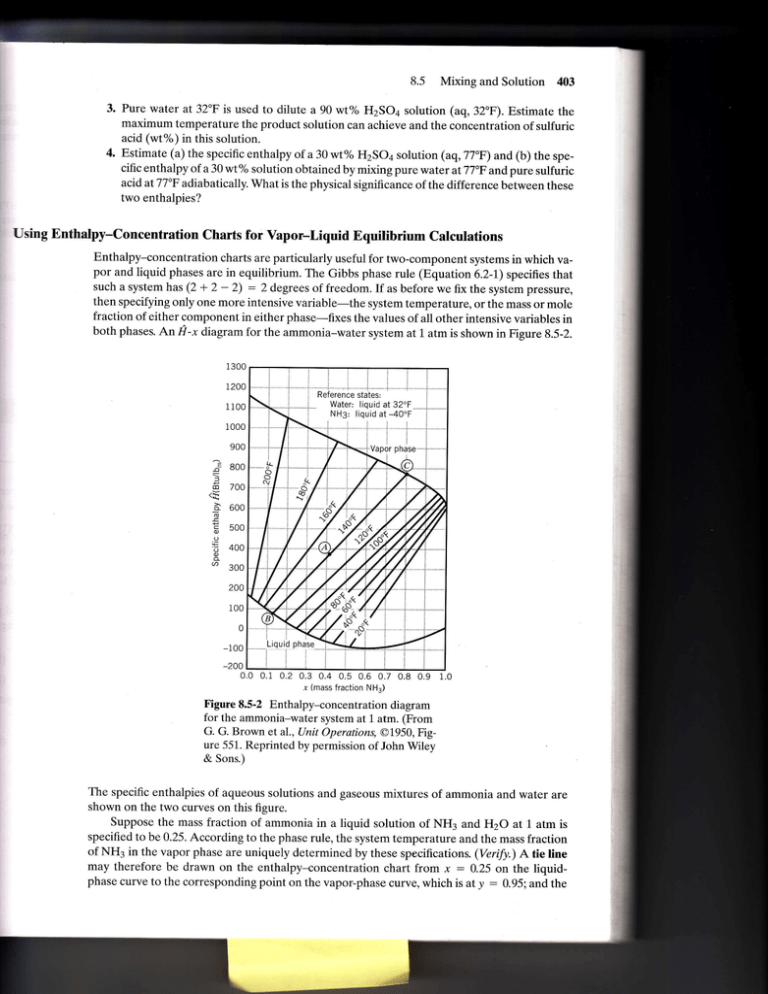
8.5 Mixing and Solution 403 3. Pure water at 32"F is used to dilute a 90 wt% H2SOa solution (aq,32"F). Estimate the maximum temperature the product solution can achieve and the concentration of sulfuric acid (wt%) in this solution. 4. Estimate (a) the specific enthalpy of a 30 wt% H2SOa solution (aq,77'F) and (b) the speciflc enthalpy of a 30 wt% solution obtained by mixing pure water at 77"F and pure sulfuric acid atTJ'F adiabatically. What is the physical significance of the difference between these two enthalpies? Using Enthalpy-Concentration Charts for Vapor-Liquid Equilibrium Calculations Enthalpy-concentration charts are particularly useful for two-component systems in which vapor and liquid phases are in equilibrium. The Gibbs phase rule (Equation 6.2-1) specifies that such a system has (2 + 2 - 2) : 2 degrees of freedom. If as before we fix the system pressure, then specifying only one more intensive variable-the system temperature, or the mass or mole fraction of either component in either phase-flxes the values of all other intensive variables in both phases. An fr-x diagram for the ammonia-water system at L atm is shown in Figure 8.5-2. 900 := 800 f do 700 _a 600 ! E 500 to to 400 .9 3oo 200 100 0 0.0 0.1 0.2 0.3 0.4 0.5 0.6 0.7 0.8 0.9 x (mass fraction NH3) Figure 8.5-2 Enthalpy-concentration diagram for the ammonia-water system at 1 atm. (From G. G. Brown et al., Unit Operations, @1950, Figure 551. Reprinted by permission of John Wiley & Sons.) The specific enthalpies of aqueous solutions and gaseous mixtures of ammonia and water are shown on the two curves on this flgure. Suppose the mass fraction of ammonia in a liquid solution of NH3 and H2O at 1 atm is specifled to be 0.25. According to the phase rule, the system temperature and the mass fraction of NH3 in the vapor phase are uniquely determined by these speciflcations. (Veri[y.) A tie line may therefore be drawn on the enthalpy-concentration chart from x : 0.25 on the liquidphase curve to the corresponding point on the vapor-phase curve, which is at y : g.95. and the


