Participants by Countries (by nationalities)*
advertisement
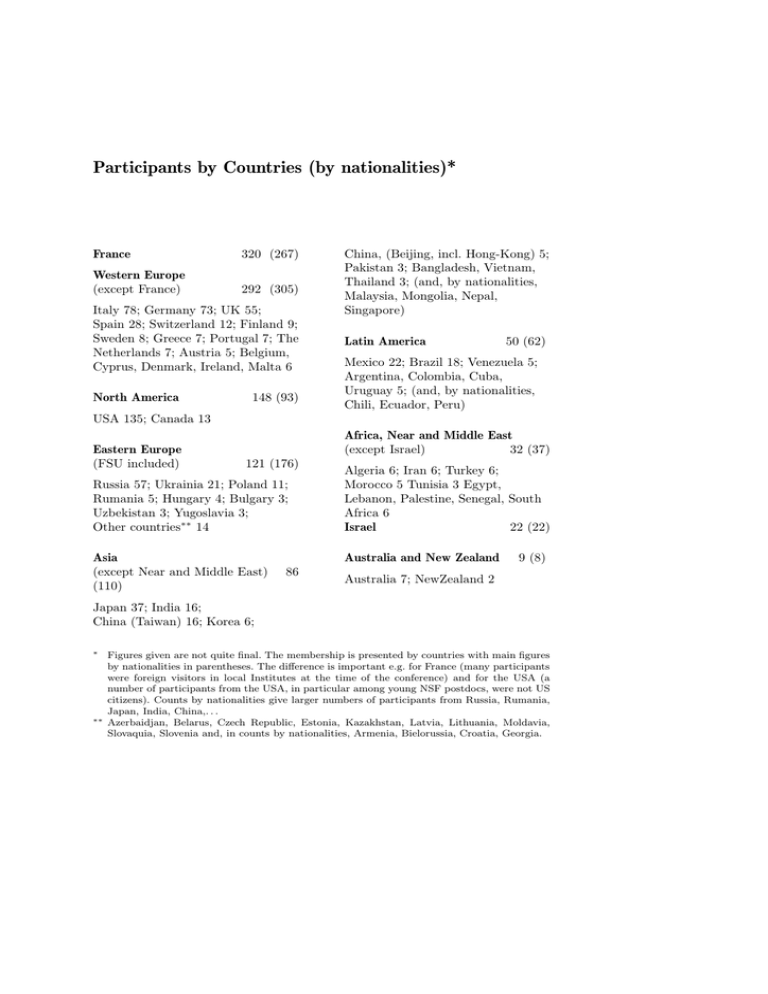
Participants by Countries (by nationalities)* France 320 (267) Western Europe (except France) 292 (305) Italy 78; Germany 73; UK 55; Spain 28; Switzerland 12; Finland 9; Sweden 8; Greece 7; Portugal 7; The Netherlands 7; Austria 5; Belgium, Cyprus, Denmark, Ireland, Malta 6 North America 148 (93) China, (Beijing, incl. Hong-Kong) 5; Pakistan 3; Bangladesh, Vietnam, Thailand 3; (and, by nationalities, Malaysia, Mongolia, Nepal, Singapore) Latin America 50 (62) Mexico 22; Brazil 18; Venezuela 5; Argentina, Colombia, Cuba, Uruguay 5; (and, by nationalities, Chili, Ecuador, Peru) USA 135; Canada 13 Eastern Europe (FSU included) Africa, Near and Middle East (except Israel) 32 (37) 121 (176) Russia 57; Ukrainia 21; Poland 11; Rumania 5; Hungary 4; Bulgary 3; Uzbekistan 3; Yugoslavia 3; Other countries∗∗ 14 Asia (except Near and Middle East) (110) Algeria 6; Iran 6; Turkey 6; Morocco 5 Tunisia 3 Egypt, Lebanon, Palestine, Senegal, South Africa 6 Israel 22 (22) Australia and New Zealand 86 9 (8) Australia 7; NewZealand 2 Japan 37; India 16; China (Taiwan) 16; Korea 6; ∗ ∗∗ Figures given are not quite final. The membership is presented by countries with main figures by nationalities in parentheses. The difference is important e.g. for France (many participants were foreign visitors in local Institutes at the time of the conference) and for the USA (a number of participants from the USA, in particular among young NSF postdocs, were not US citizens). Counts by nationalities give larger numbers of participants from Russia, Rumania, Japan, India, China,. . . Azerbaidjan, Belarus, Czech Republic, Estonia, Kazakhstan, Latvia, Lithuania, Moldavia, Slovaquia, Slovenia and, in counts by nationalities, Armenia, Bielorussia, Croatia, Georgia.
