HPER 3150 Descriptive Statistics Review
advertisement

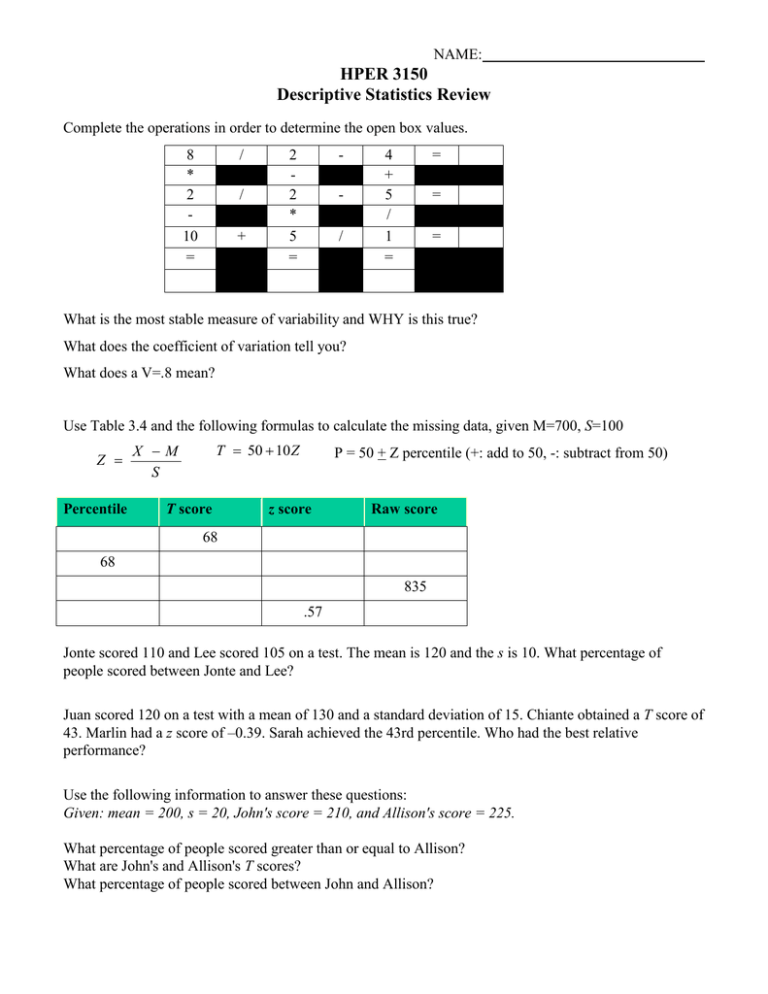
NAME: HPER 3150 Descriptive Statistics Review Complete the operations in order to determine the open box values. 8 * 2 10 = / / + 2 2 * 5 = / 4 + 5 / 1 = = = = What is the most stable measure of variability and WHY is this true? What does the coefficient of variation tell you? What does a V=.8 mean? Use Table 3.4 and the following formulas to calculate the missing data, given M=700, S=100 Z Percentile T 50 10 Z X M S T score P = 50 + Z percentile (+: add to 50, -: subtract from 50) z score Raw score 68 68 835 .57 Jonte scored 110 and Lee scored 105 on a test. The mean is 120 and the s is 10. What percentage of people scored between Jonte and Lee? Juan scored 120 on a test with a mean of 130 and a standard deviation of 15. Chiante obtained a T score of 43. Marlin had a z score of –0.39. Sarah achieved the 43rd percentile. Who had the best relative performance? Use the following information to answer these questions: Given: mean = 200, s = 20, John's score = 210, and Allison's score = 225. What percentage of people scored greater than or equal to Allison? What are John's and Allison's T scores? What percentage of people scored between John and Allison?


