433-643 IT Project Management Activity Planning
advertisement
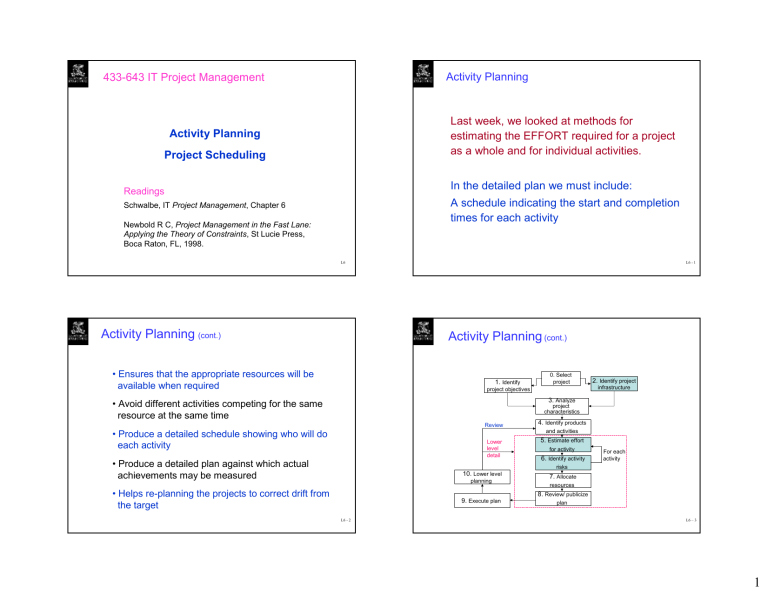
Activity Planning
433-643 IT Project Management
Last week, we looked at methods for
estimating the EFFORT required for a project
as a whole and for individual activities.
Activity Planning
Project Scheduling
In the detailed plan we must include:
Readings
A schedule indicating the start and completion
times for each activity
Schwalbe, IT Project Management, Chapter 6
Newbold R C, Project Management in the Fast Lane:
Applying the Theory of Constraints, St Lucie Press,
Boca Raton, FL, 1998.
L6
Activity Planning (cont.)
L6 - 1
Activity Planning (cont.)
• Ensures that the appropriate resources will be
available when required
1. Identify
0. Select
project
2. Identify project
infrastructure
project objectives
3. Analyze
• Avoid different activities competing for the same
resource at the same time
project
characteristics
Review
4. Identify products
and activities
• Produce a detailed schedule showing who will do
each activity
Lower
level
detail
• Produce a detailed plan against which actual
achievements may be measured
5. Estimate effort
for activity
6. Identify activity
For each
activity
risks
10. Lower level
planning
• Helps re-planning the projects to correct drift from
the target
7. Allocate
resources
8. Review/ publicize
9. Execute plan
L6 - 2
plan
L6 – 3
1
Milestones
Humans are Optimistic!
People estimated that coding was 90% finished
for about half the time when it was in process
¾
Milestones are scheduling tools very
useful in coordinating interrelated projects.
Debugging was estimated to be 99% complete
most of the time it was underway.
¾
Milestones are events denoting the
completion of a project phase.
¾
Milestones are schedules as activities with
zero duration reflecting completion of a
block of work.
The time required for computer tasks is very difficult
to estimate accurately
Studies have shown where estimates are updated
every two weeks, there was very little change in
estimated duration until the activity actually started
L6 - 4
Sequencing and Scheduling
L6 - 5
Dependencies
Dependency or relationship shows the sequencing of project
activities or task.
Sequencing: identifying dependencies among
activities dictated by the development process
For example, can the project team do activities in parallel?
Scheduling: specifying when the activity should take
place
Mandatory dependencies – hard logic. For example, you can
not test the code until after the code is written
Sequence the tasks according to their logical
relationships, and Schedule them taking into account
resources and other factors
Discretionary dependencies – soft logic: defined by the project
team. For example, a project team might follow good practice
and not start the detailed design of a system until the users
sign off on all the analysis work.
Approaches to scheduling that achieve this
separation between the logical and the physical
use networks to model the project
External dependencies – relationship between project and
non-project activities. For example, installation of a new
operating system and other software may depend on delivery
of the new hardware from an external supplier.
L6 - 6
L6 - 7
2
Events versus activities
Network Diagram - Events versus activities
Ev e n t
Event = a point in time, has no duration
(e.g the start or end of an activity)
do B
do A
do D
Activity = a task or an action with a recognizable
start and finish and a duration
do C
Ac t ivit y
do A
events
do B
Prepare breakfast
Eat breakfast
do D
do C
activities
L6 - 8
Effort and elapsed time
L6 – 9
Start and Finish times
‘Time is nature’s way of stopping everything
happening at once’
Latest finish
Earliest start
activity
…the difference between elapsed time and effort
Latest start
(effort: the amount of work that needs to be done,
elapsed time: the time between start and end of a
task)
examples: baking bread, brewing beer
L6 – 10
Earliest finish
• Activity ‘write report software’
• Earliest start (ES)
• Earliest finish (EF) = ES + duration
• Latest finish (LF) = latest task can be completed
without affecting project end
• Latest start = LF - duration
L6 - 11
3
Start and Finish times - Example
• earliest start = day 5
• latest finish = day 30
• duration = 10 days
Notation
Activity label
earliest finish = ?
latest start = ?
ES
duration
EF
Activity description
LS
LF
Activity span
Float
Float = LF - ES - duration
ES
What is it in this case?
EF
Activity label
LS
duration
LF
L6 - 12
Earliest start date
L6 - 13
Example: ES for Activity G?
Earliest start date for the current activity =
earliest finish date for the previous activity
When there is more than one previous activity,
take the latest earliest finish
B
Duration 6
Duration 8
ES B = Max {ES X + Duration X }
E
A
Note ‘day 7’ = end of work on day 7
Duration 5
G
C
Duration 10
F
D
Duration 3
Duration 4
EF = day 7
ES = day10
ES = day 0
EF = day10
Duration 9
L6 - 14
L6 – 15
4
Complete the table
Activity ES
0
A
B
5
5
C
5
D
E
F
G
Latest start dates
duration EF
5
¾
5
¾
Start from the last activity
Latest finish (LF) for last activity = earliest finish (EF)
work backwards
Latest finish for current activity = Latest start for the
following activity
¾ More than one following activity, take the earliest LS
6
¾
10
9
LFA = Min{LFX − Duration X }
¾
Latest start (LS) = LF for activity - duration
L6 - 16
Complete the table
Example: LS for all activities?
Activity ES
0
A
5
B
5
C
5
D
E
F
G
B
Duration 6
E
Duration 8
A
Duration 5
G
C
Duration 10
D
F
L6 - 17
Duration 4
Duration 3
ES = day 0
Duration 9
L6 - 18
Dur EF
LS
LF
5
6
10
9
8
3
4
L6 - 19
5
Float
Complete the table
Activity
Float = Latest finish –
Earliest start –
Duration
LF
activity
Latest start
Dur EF
LS
LF
Float
A
B
C
D
E
F
G
FLOAT
ES
ES
Earliest Finish
L6 - 20
Critical path
Note the path through network with zero floats
Critical path: any delay in an activity on this
path will delay whole project
L6 - 21
Scheduling: Time Planning - Tools and Techniques
z
Four main stages –
¾
¾
➨ Can there be more than one critical path?
¾
identify the constituent activities
determine their logical sequence
prepare estimate of time and resource
present the plan in an intelligent format
To develop detailed time plans, we use various
graphical techniques to allow the construction of
a comprehensive picture of project activities to
communicate with other
➨ Can there be no critical path?
➨ Sub-critical paths
L6 - 22
L6 - 23
6
Scheduling
Project Networks
Representing the project as a Network of
interconnected activities
Establishing the start and finish times of all
Project activities given their
● durations,
● predecessors
The interconnections represent the activity
dependencies
Network Diagram (logic chart)
GERT (graphical evaluation and review technique)
PERT (program evaluation and review technique)
CPM (critical path method)
PDM (precedence diagramming method)
AOA (activity on arrow) or ADM (arrow diagramming method)
L6 - 24
L6 - 25
CPM and PERT
CPM assumes that both the activity
estimates and the precedence logic are
fixed. Concentrates on Time/Cost
trade-off .
PERT allows for probabilistic treatment
of the activity duration estimates by
using a three-point estimate (pessimist,
most likely, optimist), but assumes
network logic is fixed.
Next week
• Scheduling: Time Planning Methods
CPM
Project crashing
PERT
L6 - 26
7
