Document 14618246
advertisement
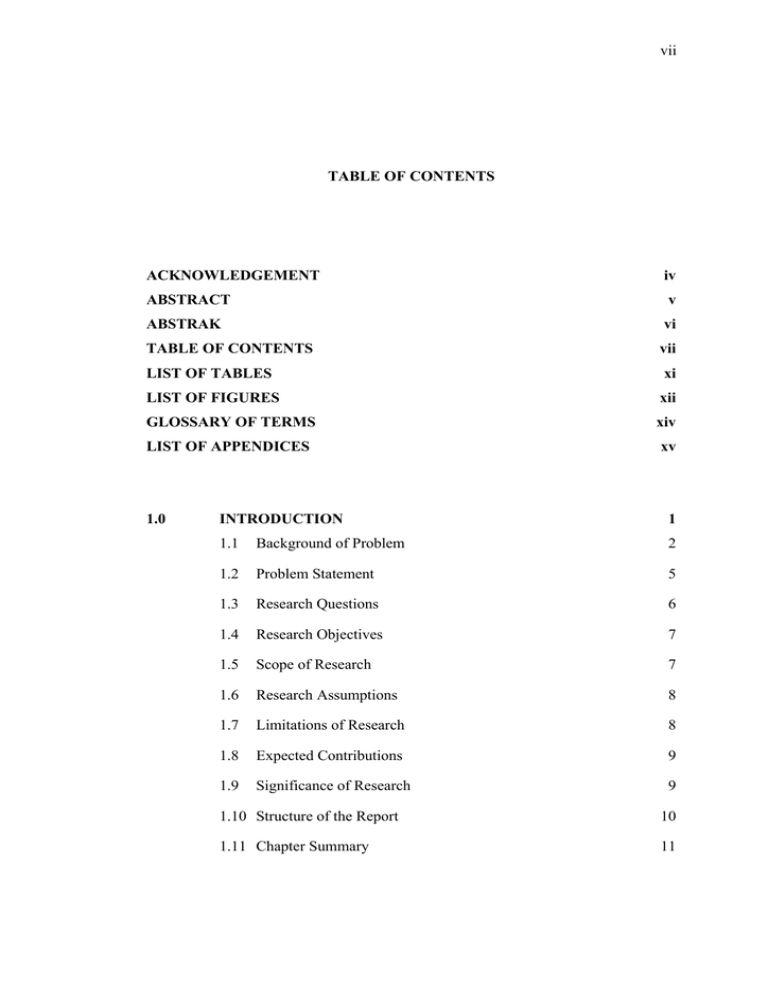
vii TABLE OF CONTENTS ACKNOWLEDGEMENT iv ABSTRACT v ABSTRAK vi TABLE OF CONTENTS vii LIST OF TABLES xi LIST OF FIGURES xii GLOSSARY OF TERMS xiv LIST OF APPENDICES xv 1.0 INTRODUCTION 1 1.1 Background of Problem 2 1.2 Problem Statement 5 1.3 Research Questions 6 1.4 Research Objectives 7 1.5 Scope of Research 7 1.6 Research Assumptions 8 1.7 Limitations of Research 8 1.8 Expected Contributions 9 1.9 Significance of Research 9 1.10 Structure of the Report 10 1.11 Chapter Summary 11 viii 2.0 3.0 WALKWAY SPACE FOR PEDESTRIANS 12 2.1 Definition of A Pedestrians’ Walkway 12 2.2 Walking as a Mode of Transportation 13 2.3 Pedestrian as a Public Place 13 2.4 Typical Problems of A Pedestrians’ Walkway 14 2.4.1 Network 14 2.4.2 Pedestrial/Vehicular Separation 15 2.4.3 Amenities 15 2.5 Planning and designing for Pedestrians 16 2.6 Regulation for Pedestrians 18 2.7 Pedestrian LOS (Level of Service) 20 2.7.1 Pedestrian HCM LOS Strengths and Weaknesses 23 2.8 Pedestrians’ Walkways and Spatial Configuration 24 2.9 The Actual Pattern of Pedestrians Flow 25 2.10 Chapter Summary 26 RESEARCH METHODOLOGY 27 3.1 Introduction 27 3.2 Study Variables 28 3.3 Data Sources 28 3.3.1 Primary Data 29 3.3.2 Secondary Data 29 Methodology 29 3.4.1 Observational Field Method 30 3.4.2 Gate Count Method 30 Case Study 30 3.5.1 Case Study 1: Pantai Chenang, Langkawi. 31 3.4 3.5 ix 4.0 3.5.2 Case Study 2: Melaka Historical City, Melaka 32 3.6 Reliability and Validity 32 3.7 Comparative Analysis 33 3.8 Chapter Summary 33 DATA COLLECTION AND ANALYSIS 34 4.1 Observation Field 35 4.1.1 Case Study 1: Pantai Chenang, Langkawi 35 4.1.2 Case Study 2: Melaka Historical City 39 Data Collection 43 4.2.1 Case Study 1: Pantai Chenang, Langkawi. 43 4.2.2 Case Study 2: Melaka Historical City 46 Analysis on The Utilization of Pedestrians’ Walkway 49 4.3.1 Method 49 4.3.2 Utilization of Pedestrians’ Walkway 50 Summary 55 4.2 4.3 4.4 5.0 RESULTS AND FINDINGS 56 5.1 Case Study 1: Pantai Chenang, Langkawi 56 5.1.1 Existing Pedestrians’ Walkway 56 5.1.2 Visualization of Pedestrians Flow 59 5.1.3 Utilization Result from Pedestrians Count 61 Case Study 2: Melaka Historical City 62 5.2.1 Existing Pedestrians’ Walkway 62 5.2.2 Visualization of Pedestrians’ Flow 63 5.2.3 Utilization Results from Pedestrians Count 65 5.2 x 6.0 5.3 Comparison of Existing and Actual Patterns 66 5.4 Chapter Summary 69 RECOMMENDATION AND CONCLUSIONS 70 6.1 Introduction 70 6.2 Planning and Design 71 6.2.1 Pantai Chenang, Langkawi 71 6.2.2 Melaka Historical City, Melaka 74 6.3 Policy Statement 76 6.4 Improvement In The Method of Study 78 6.5 Conclusion 79 REFERENCES A PHONE CALL QUESTIONNAIRE 83 B PEDESTRIAN COUNT FORM / GATE COUNT FORM 90 C OBSERVATIONAL FIELD/VISUAL SURVEY 92 xi LIST OF TABLES TABLE NO. TITLE PAGE Table 1-1 The scope of study 7 Table 2-1 Average Flow LOS Criteria for Walkways and Sidewalks 21 Table 2-2 Platoon-Adjusted LOS Criteria for Walkways and Sidewalks 23 Table 3-1 Mapping of Hypothesis to Study Variables 28 Table 4-1 Information on Pedestrian Walkway at Pantai Chenang 37 Table 4-2 Information on Pedestrian Walkway at Melaka Historical City 41 Table 4-3 Pedestrian Count at Pantai Chenang 43 Table 4-4 Spatial Activities (Building Used) along the Gates Parameter 45 Table 4-5 Pedestrian Count at Melaka Historical City 46 Table 4-6 Spatial Activities (Building Used) along the Gates Parameter 49 Table 4-7 Pedestrian Utilization Range Value 51 Table 4-8 Pedestrian Utilization Calculation Result at Pantai Chenang 53 Table 4-9 Pedestrian Utilization Calculation Result at Melaka Historical City 54 xii LIST OF FIGURES FIGURE NO. TITLE PAGE Figure 1-1 Existing pedestrians’ walkway on the left and right of the road at Pantai Chenang Figure 1-2 Ideal Pedestrian/Cyclist Facility 2 3 Figure 1-3 The number of pedestrians flow in block per ten minutes in the case of Shibuya Station, Tokyo, Japan Figure 1-4 Condition of pedestrians’ walkways at Prescient 9, Putrajaya. 4 6 Figure 2-1 Walkways damaged by the installation of utilities and without maintenance by the local authorities due to under-utilization. 15 Figure 2-2 Continuity for Pedestrians to Reach Destination 16 Figure 2-3 Pedestrians away from Street and Lighting. 17 Figure 2-4 Protection from the Hot Sun and Heavy Rain. 17 Figure 2-5 Pedestrian LOS according to HCM 22 Figure 3-1 Diagram of Research Methodology. 29 Figure 3-2 Study area of Pantai Chenang, Langkawi. 31 Figure 3-3 Study area of Melaka Historical City, Melaka. 32 Figure 4-1 Location Map of Case Study 1: Pantai Chenang, Langkawi 35 Figure 4-2 Map of the Existing Pedestrians’ Walkway at Pantai Chenang, Langkawi 36 Figure 4-3 Map of the Visualization Observations of Pedestrians’ Walkway at Pantai Chenang Figure 4-4 Location Map of Case Study 2: Melaka Historical City 38 39 Figure 4-5 Map of the Existing Pedestrians’ Walkway at Melaka Historical City 40 Figure 4-6 Map of the Visual Observations of Pedestrians’ Walkway at Melaka Historical City 42 xiii Figure 4-7 Map of the Gates Parameter Distribution On The Pedestrians’ Walkway at Pantai Chenang 44 Figure 4-8 Map of the Gates Parameter Distribution On The Pedestrians’ Walkway at Melaka Historical City 47 Figure 4-9 Map of the Activities Zoning at Melaka Historical City 48 Figure 4-10 Map of the Pedestrian Utilization Result at Pantai Chenang 51 Figure 4-11 Map of the Pedestrians Utilization Result at Melaka Historical City 52 Figure 5-1 Condition of pedestrian walkways (Gate 7) impeded by the provision of utilities and landscaping. 57 Figure 5-2 Condition of a pedestrians’ walkway (Gate 10) which provides a safety element such as a barrier between vehicles traffic and pedestrians. Figure 5-3 Trees provide shade 58 58 Figure 5-4 Result of the Visual Observations On The Pedestrians’ Walkway at Pantai Chenang 59 Figure 5-5 Picture showing pedestrian flow in beach area. 60 Figure 5-6 Pedestrians’ utilization in Pantai Chenang 61 Figure 5-7 Exiting Pedestrians’ Walkway in Melaka Historical City 62 Figure 5-8 Results of the Visual Observation at Melaka Historical City 63 Figure 5-9 Jonker Walk is a lively pedestrians’ walkway 64 Figure 5-10 Pedestrians are exposed to motor vehicles traffic 64 Figure 5-11 Pedestrians utilization in Melaka Historical City 65 Figure 5-12 Diagram Showing The Comparison Between Existing Pedestrians with Pedestrians Visualization and Pedestrians Utilization in Pantai Chenang. Figure 5-13 Pedestrians Visualization and Pedestrians Utilization Comparison 66 67 Figure 5-14 Diagram Showing the Comparison between Existing Pedestrians with Pedestrians’ Visualization and Pedestrians’ Utilization in Melaka Historical City. 68 Figure 6-1 Pedestrians’ Walkway Priority 71 Figure 6-2 Pedestrians’ Walkway in Coastal Area 72 Figure 6-3 Pantai Chenang Road closed for Pedestrians User. 73 Figure 6-4 Pedestrians conflict with motor vehicles is solved 74 Figure 6-5 Proposal for the covered Pedestrian Walkway 75 xiv GLOSSARY OF TERMS LRT - Light Rapid Transit DBKL - Dewan Bandaraya Kuala Lumpur GIS - Geography Information System HCM - Highway Capacity Manual LOS - Level of Service TRB - Transportation Research Board PB - Planning Block LADA - Langkawi Development Authority LMC - Langkawi Municipal Council MHCC - Melaka Historic City Council xv LIST OF APPENDICES APPENDIX TITLE PAGE A PHONE CALL QUESTIONNAIRE 83 B PEDESTRIAN COUNT FORM / GATE COUNT FORM 90 C OBSERVATIONAL FIELD/VISUAL SURVEY 92
