vii TABLE OF CONTENTS CHAPTER
advertisement
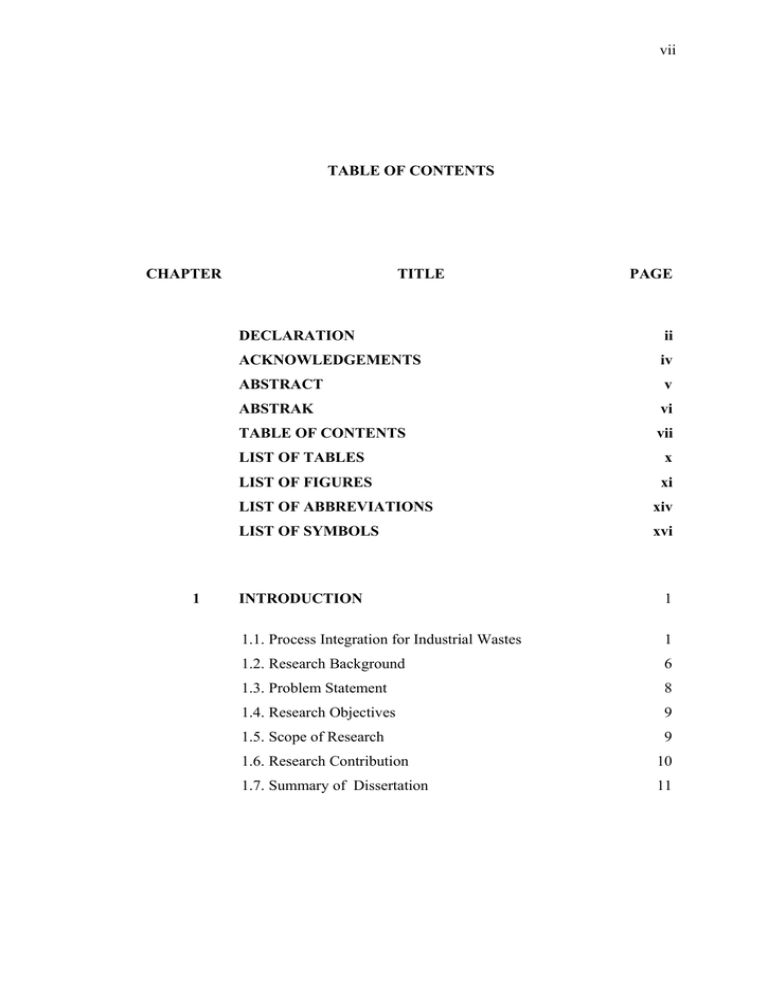
vii TABLE OF CONTENTS CHAPTER 1 TITLE PAGE DECLARATION ii ACKNOWLEDGEMENTS iv ABSTRACT v ABSTRAK vi TABLE OF CONTENTS vii LIST OF TABLES x LIST OF FIGURES xi LIST OF ABBREVIATIONS xiv LIST OF SYMBOLS xvi INTRODUCTION 1 1.1. Process Integration for Industrial Wastes 1 1.2. Research Background 6 1.3. Problem Statement 8 1.4. Research Objectives 9 1.5. Scope of Research 9 1.6. Research Contribution 10 1.7. Summary of Dissertation 11 viii 2 LITERATURE REVIEW 13 2.1. Introduction 13 2.2. MEN Targeting with Pinch Analysis 14 2.3. MEN Design with Insight-Based Approach 19 2.4. MEN Synthesis by Mathematical Programming 20 2.5. Simultaneous Targeting and Design for MEN 24 2.6. Simultaneous Targeting and Design for HEN 25 2.7. The State of The Art in Pinch-based Simultaneous Targeting and Design for MEN 3 FUNDAMENTAL THEORY 28 3.1. Introduction 28 3.2. Process Synthesis 28 3.3. Pinch Analysis 30 3.4. Mass Exchange Network (MEN) Synthesis 31 3.4.1. Targeting Stage 33 3.4.2. Network Design 42 3.5. Economic Evaluation 4 25 45 3.5.1. Sizing of Mass Exchanger Unit 45 3.5.2. Total Annual Cost (TAC) 50 METHODOLOGY 52 4.1. Introduction 52 4.2. A New Graphical Technique for Simultaneous Targeting and Design of MEN 53 4.3. Case Study in a Wastewater Cleaning Problem 54 4.4. Step 1: Rich and Lean Streams Data Specification 56 4.5. Step 2: Continuous Individual Plot (CIP) Curves Construction 57 4.6. Step 3: Minimum MSA and Minimum Number of Unit Determination 61 ix 4.6.1. Single Pinch 61 4.6.2. Threshold 65 4.6.3. Multiple Pinch 67 4.7. Mass Allocation Network (MAN) Diagram for Simultaneous Network Design 5 6 71 4.8. Network Evolution 74 4.9. Economic Evaluation 79 RESULTS AND DISCUSSION 83 5.1. Case Study 1: Phenolic wastewater in an oil refinery 83 5.1.1. Introduction 83 5.1.2. Data and Equilibrium Relation 84 5.1.3. Continuous Individual Plot (CIP) Curves 86 5.1.4. Mass Allocation Network (MAN) Diagram 87 5.1.5. Economic Evaluation 91 5.1.6. Comparison with Composite Curves 94 5.2. Case Study 2: Dephenolisation of aqueous waste 95 5.2.1. Introduction 95 5.2.2. Data and Equilibrium Relation 96 5.2.3. Continuous Individual Plot (CIP) Curves 97 5.2.4. Mass Allocation Network (MAN) Diagram 104 5.2.5. Network Evolution 106 5.2.6. Economic Evaluation 107 5.2.7. Comparison with Composite Curves 112 CONCLUSION AND RECOMMENDATION 114 6.1. Summary and Significance 114 6.2. Recommendation 115 REFERENCES 118 x LIST OF TABLES TABLE NO. TITLE PAGE 4.1 Data of rich streams for wastewater cleaning problem 55 4.2 Data of lean streams for wastewater cleaning problem 55 4.3 Corresponding composition scale for lean streams 57 4.4 Rich stream data for multiple pinch problem 68 4.5 Lean stream data for multiple pinch problem 68 4.6 External MSA data for wastewater cleaning problem 76 4.7 S3 profiles for external MSA unit 79 4.8 Summary of capital cost for external MSA matches 81 5.1 Data of rich streams for case study 1 85 5.2 Data of lean streams for case study 1 85 5.3 S3 profiles for case study 1 91 5.4 Summary of capital cost for external MSA matches 92 5.5 Data of rich streams for case study 2 96 5.6 Data of lean streams for case study 2 96 5.7 Impact of S2 reduction to number of stages for case study 2 103 5.8 Summary of capital cost for external MSA matches 110 xi LIST OF FIGURES FIGURES NO. TITLE PAGE 1.1 Water uses 2 1.2 Malaysia: composition of wastewater by sector 3 1.3 Comparison of conventional and pinch technique 5 1.4 A mass-based separation system from a species viewpoint with MSAs for interception 6 3.1 The onion diagram for process design 29 3.2 A schematic representation of a mass exchanger 31 3.3 Mass load representation of two rich streams 35 3.4 Composite rich streams using superposition 36 3.5 Mass load representation of two rich streams 38 3.6 Composite lean streams using superposition 38 3.7 Mass-pinch composite curves diagram 39 3.8 Mass grid diagram showing stream match 43 3.9 Match feasibility 44 3.10 The McCabe Thiele diagram 46 4.1 Key steps in CIP method of MEN synthesis 53 4.2 Rich CIP (Rcip) curves for wastewater cleaning problem 59 4.3 Rich CIP (Rcip) curves for wastewater cleaning problem 60 4.4 Combined rich and lean CIP curves for wastewater cleaning problem 60 4.5 Mass pinch point for wastewater cleaning problem 61 4.6 Eliminating excess MSA with composition reduction 63 4.7 Eliminating excess MSA with flowrate reduction 63 4.8 Threshold problem 66 xii 4.9 Shifted Lcip-1 for the threshold problem 67 4.10 Multiple pinch problem 69 4.11 Stream splitting for S1 70 4.12 Final CIP curves showing global pinch point 71 4.13 MAN diagram for wastewater cleaning problem 73 4.14 Network design for wastewater cleaning problem 74 4.15 CIP curves before network evolution for wastewater cleaning problem 4.16 75 CIP curves after network evolution for wastewater cleaning problem 76 4.17 Parallel configuration of external MSA 77 4.18 Series configuration of external MSA 78 4.19 Final MAN diagram for wastewater cleaning problem 82 4.20 Final network design wastewater cleaning problem 82 5.1 Schematic representation of an oil refinery 84 5.2 CIP curves for case study 1 86 5.3 CIP curves after shifting Lcip 87 5.4 MAN diagram for case study 1 88 5.5 Network design for case study 1 89 5.6 CIP curves with external MSA in parallel configuration 90 5.7 CIP curves with external MSA in series configuration 90 5.8 Final MAN diagram for case study 1 93 5.9 Final network design for case study 1 93 5.10 Composite curve for case study 1 94 5.11 Schematic representation of an oil recycling plant 95 5.12 CIP curves for case study 2 97 5.13 CIP curves showing local pinches after Lcip shift 98 5.14 CIP curves showing stream splitting 99 5.15 CIP curves after split streams pairing 100 5.16 Eliminating excess process MSA by S2 flowrate reduction 101 5.17 CIP curves without excess process MSA after S2 flowrate reduction 5.18 101 Eliminating excess process MSA by S2 composition reduction 102 xiii 5.19 CIP curves without excess process MSA after S2 composition reduction 103 5.20 MAN diagram for case study 2 without external MSA 105 5.21 Network evolution with combined excess R2 106 5.22 CIP curves with external MSA in parallel configuration 108 5.23 CIP curves with external MSA in series configuration 109 5.24 MAN diagram for case study 2 111 5.25 Network design for case study 2 112 5.26 Composite curve for case study 2 113 xiv LIST OF ABBREVIATIONS AOC - Annual Operating Cost ACC - Annual Capital Cost BOD - Biochemical Oxygen Demand CC - Composite Curves CIP - Continuous Individual Plot CIT - Composition Interval Table COG - Coke Oven Gas DCS - Distributed Control System DFP - Driving Force Plot DOE - Department of Environment GCC - Grand Composite Curve GD - Grid Diagram HEN - Heat Exchange Network HEAT - Heat Allocation and Targeting IBMS - Interval Based MINLP Superstructure LGO - Light Gas Oil LP - Linear Programming MAN - Mass Allocation Network MEN - Mass Exchange Network MEx - Mass Exchanger MILP - Mixed Integer Linear Programming MINLP - Mixed Integer Non-Linear Programming MOC - Minimum Operating Cost MSA - Mass Separating Agent NAP - Number of Actual Plate NLP - Non-Linear Programming xv NTP - Number of Theoretical Plate S&TBS - Supply and Target Based Superstructure STEP - Stream Temperature over Enthalpy Plot SWS - Stage-wise Superstructure TAC - Total Annual Cost T&SBS - Target and Supply Based Superstructure xvi LIST OF SYMBOLS α - Volume efficiency bj - Constant for the jth lean stream Cmin - Minimum removal cost for each MSA Cmsa - MSA cost ($/kg) D - Column Diameter ɛ - Minimum composition difference G - Rich stream flowrate (kg/s) Gi - Rich stream flowrate for the ith stream (kg/s) Gm - Gas flowrate (kg/second) H - Packed column height HTUx - The overall height of transfer units (lean phase) HTUy - The overall height of transfer units (rich phase) L - Lean stream flowrate (kg/s) Lj - Lean stream flowrate for the jthstream (kg/s) Lcj - Maximum lean stream flowrate (kg/s) for the jth stream mj - Mass transfer coefficient for the jth lean stream ΔM - Pollutant mass load (kg/s) Ni - Number of independent synthesis sub problem NR - Number of rich streams NS - Number of lean streams Ne - Number of equilibrium stages [Ne] - Rounded up number of equilibrium stages Nr - Number of real stages [Nr] - Rounded up number of real stages NTUx - The overall number of transfer units (lean phases) NTUy - The overall number of transfer units (rich phases) xvii R - Rich stream ηo - Overall Exchanger Efficiency ρl - Liquid density (kg/m3) ρv - Gas density (kg/m3) S - Lean stream S - Tray spacing (m) t - Operating time (year) umax - Maximum allowable gas velocity Umin - Minimum number of units uv - Actual gas velocity xlim - Limiting lean stream composition xj - jth lean stream composition xs,j - Lean stream supply composition forthe jth stream xt,i - Lean stream target composition for the jth stream xmax - Maximum achievable solute composition in MSAs x*j - Attainable composition of the lean stream (MSA) for the jth stream xct,j - The maximum permissible lean stream (MSA) target composition for the jth stream y - Rich stream composition (scale) ys,i - Rich stream supply composition for theith stream yt,i - Rich stream target composition for the ith stream y* - Modified rich stream composition Δymin - Minimum rich stream composition difference
