STUDY ON CHARACTERISTICS OF THE LOESS PLATEAU
advertisement

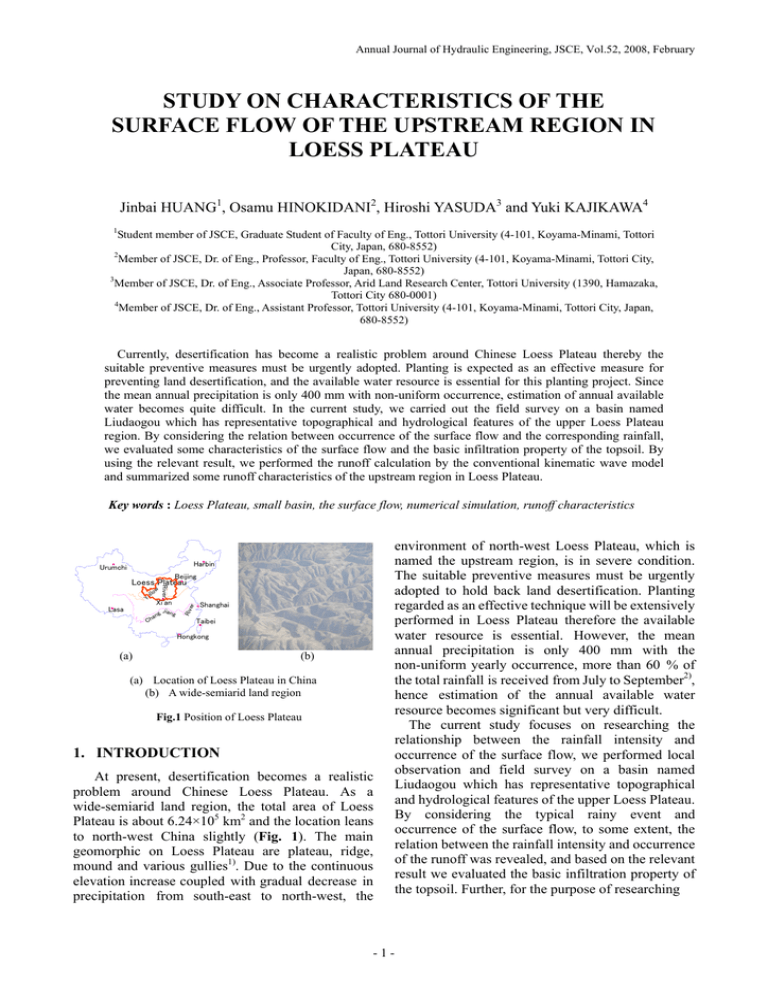
Annual Journal Journal of of Hydraulic Hydraulic Engineering, Engineering, JSCE, JSCE, Vol.52, Vol.52, 2008, February Annual STUDY ON CHARACTERISTICS OF THE SURFACE FLOW OF THE UPSTREAM REGION IN LOESS PLATEAU Jinbai HUANG1, Osamu HINOKIDANI2, Hiroshi YASUDA3 and Yuki KAJIKAWA4 1 Student member of JSCE, Graduate Student of Faculty of Eng., Tottori University (4-101, Koyama-Minami, Tottori City, Japan, 680-8552) 2 Member of JSCE, Dr. of Eng., Professor, Faculty of Eng., Tottori University (4-101, Koyama-Minami, Tottori City, Japan, 680-8552) 3 Member of JSCE, Dr. of Eng., Associate Professor, Arid Land Research Center, Tottori University (1390, Hamazaka, Tottori City 680-0001) 4 Member of JSCE, Dr. of Eng., Assistant Professor, Tottori University (4-101, Koyama-Minami, Tottori City, Japan, 680-8552) Currently, desertification has become a realistic problem around Chinese Loess Plateau thereby the suitable preventive measures must be urgently adopted. Planting is expected as an effective measure for preventing land desertification, and the available water resource is essential for this planting project. Since the mean annual precipitation is only 400 mm with non-uniform occurrence, estimation of annual available water becomes quite difficult. In the current study, we carried out the field survey on a basin named Liudaogou which has representative topographical and hydrological features of the upper Loess Plateau region. By considering the relation between occurrence of the surface flow and the corresponding rainfall, we evaluated some characteristics of the surface flow and the basic infiltration property of the topsoil. By using the relevant result, we performed the runoff calculation by the conventional kinematic wave model and summarized some runoff characteristics of the upstream region in Loess Plateau. Key words : Loess Plateau, small basin, the surface flow, numerical simulation, runoff characteristics Harbin Urumchi Beijing Lasa w lo Xi'an an Ch ji g ang Riv er l Ye River Loess Plateau Shanghai Taibei Hongkong (a) (b) (a) Location of Loess Plateau in China (b) A wide-semiarid land region Fig.1 Position of Loess Plateau 1. INTRODUCTION At present, desertification becomes a realistic problem around Chinese Loess Plateau. As a wide-semiarid land region, the total area of Loess Plateau is about 6.24×10⁵ km2 and the location leans to north-west China slightly (Fig. 1). The main geomorphic on Loess Plateau are plateau, ridge, mound and various gullies1). Due to the continuous elevation increase coupled with gradual decrease in precipitation from south-east to north-west, the -1- environment of north-west Loess Plateau, which is named the upstream region, is in severe condition. The suitable preventive measures must be urgently adopted to hold back land desertification. Planting regarded as an effective technique will be extensively performed in Loess Plateau therefore the available water resource is essential. However, the mean annual precipitation is only 400 mm with the non-uniform yearly occurrence, more than 60 % of the total rainfall is received from July to September2), hence estimation of the annual available water resource becomes significant but very difficult. The current study focuses on researching the relationship between the rainfall intensity and occurrence of the surface flow, we performed local observation and field survey on a basin named Liudaogou which has representative topographical and hydrological features of the upper Loess Plateau. By considering the typical rainy event and occurrence of the surface flow, to some extent, the relation between the rainfall intensity and occurrence of the runoff was revealed, and based on the relevant result we evaluated the basic infiltration property of the topsoil. Further, for the purpose of researching Legend Study location The boundary of Loess Plateau region Isohyetal line 110°21' 110°23' 38°51' Study location Thickness: about 8 cm Sand yellow ocher River Hohhot rive r City Thickness: over 10 m Y 20 ello w 0m m Hard yellow ocher Yinchuan Yulin Yellow riv er 30 0m m Shenmu Taiyuan 40 0m m Jingbian Yan River oR Lu Lanzhou Yan'an 0m 60 r ive gR Jin m Tongchuan Ye Wei Ri ver Sandstone N r ive 500m m llow B1 r rive W E S 200 0 (a)Typical terrain 600 400 (b) Schematic of the ground 38°46' Xian Fig.4 Typical terrain and ground situation of Liudaogou (a) (b) (a) Position of Liudaogou in Loess Plateau3) (b) Location and extent of Liudaogou4) Water level recorder Rain gauge Fig.2 Position of Liudaoghou basin 0 Dec 100 1600 Nov 1400 Oct 200 Sep 1200 Aug 400 300 Jul 800 1000 Jun 500 May 600 Apr 600 Mar. 400 Feb. 800 700 Monthly precipitation (mm) 1989 1986 1983 1980 1977 1974 1971 1968 1965 1962 1959 Year 0 200 Jan. Annual precipitation (mm/y) 1956 Annual precipitation of the study basin (1956-1989) (a)Rain gauge N E W Road S 0 100 200 300 (m) (c) Devices installed spots Month Fig.3 Annual precipitation in study location (Meteorological Observatory of Shenmu City) (b) Water level recorder the runoff characteristics, we examined the applicability of the conventional runoff calculation model which is constructed by kinematic wave theory. As this type of runoff calculation model was applicable to the actual condition of the upper Loess Plateau, we performed the runoff calculation for the study location. 2. GENERAL SITUATION (1) Position and area Position of Liudaogou is shown in Fig. 2, (110o21’-110o23’ E longitude and 38o46’-38o51’ N latitude). Area of this basin is 6.89 km2 and the length of the main river channel is about 4.21 km which treads from south to north2). (2) Climate Temperate continental climate is remarkable. The monsoon is prevalent and the mean annual wind speed is 2.5-2.7 m/s. Though the mean annual precipitation is 437.4 mm, 77.4 % of the total occurs in rainy season and generally with heavy rain for several times (Fig. 3). In spring and winter the climate is extremely dry with frequent gale, so that the sandstorm occurs readily with an average frequency of thirteen per year in recent years. The annual potential evapotranspiration surpasses 1000 -2- Fig. 5 Local observation and devices installed spots mm which is about 2.5 times of the yearly rainfall. (3) Terrain and ground Elevation of the study location is 1094.0 m-1273.9 m, terrain is considerably complicated, many gullies in various scales distribute around the main river channel (Fig. 4a). Due to the long-term wind erosion, the topsoil of which thickness is about 0.10 m becomes quite loose. Subsequent to the topsoil is the hard yellow ocher with thickness over 10 m, and the bottom is sandstone which was formed in Jurassic period of Mesozoic5). The schematic diagram of the representative ground is as Fig. 4b. 3. FIELD SURVEY CONSIDERATION AND RESULT (1) Field survey The rainfall data and water level data are essential for evaluating the relation between the rainfall and occurrence of the surface flow. Because the ground condition of Liudaogou is in similar situation, we performed the field survey and local observation on upper reach of B1 basin (Fig. 2b). a) Topographic survey The hypothetical channel network of B1 basin Earth-filled dam Th ie n grad e me a Discharge (m3/s) .0234 nt: I=0 Farmland 1165 1160 1155 0.6 0 0.45 2 4 0.3 rainfall discharge 0.15 6 8 0 200 400 600 800 1000 0:55 0:25 23:55 23:25 22:55 22:25 21:55 21:25 20:55 20:30 River channel 1150 1145 20:00 0 19:30 Elevation (m) Water level recorder Rainfall intensity (mm/5min) Relation between the rainfall and runoff (11 Aug. 2004) The longitudinal profile of the river channel (gully) 1200 1195 1190 1185 1180 1175 1170 Time 1200 Distance (m) (a) Fig. 6 Longitudinal profile of the river channel (Nov. 2004) (14 Aug. 2004) 0.024 0.9 rainfall discharge 0.008 1.2 14 hours 50 minutes 0.004 1.5 0 7:35 6:05 4:35 3:05 1:35 0:05 22:35 21:05 19:35 18:05 16:35 15:05 13:35 Fig. 7 Lateral profile of the river channel (Aug. 2006) 12:05 1.8 9:05 Lateral distance (cm) Rainfall intensity (mm/5min) 300 0.6 0.012 10:35 200 0.3 0.016 7:35 100 0 0.02 6:05 0 Discharge (m3/s) Depth (cm) Relation between the rainfall and runoff 100 80 60 40 20 0 Time (b) (2) Discharge calculation We adopted the representative data of the rainfall and the water level, which were observed during the period from August 10 to August 22, 2004, to perform the calculation of the surface flow. The intensive rainy events occurred several times during this calculation time. Every rainy event and the corresponding occurrence of the surface flow are -3- Relation between the rainfall and runoff 2.4 0 2 4 1.6 8 1.2 12 0.8 rainfall discharge 0.4 16 Rainfall intensity (mm/5min) Discharge (m3/s) (21 Aug. 2004) 20 0:00 23:30 23:00 22:30 22:00 21:30 21:00 20:30 20:00 0 Time (c) Relation between the rainfall and runoff 2.4 0 2 4 1.6 8 1.2 rainfall discharge 0.8 12 4:40 4:30 4:20 4:10 4:00 3:50 3:40 3:30 3:20 3:10 3:00 20 2:50 16 0 2:40 0.4 Rainfall intensity (mm/5min) (22 Aug. 2004) Discharge (m3/s) was made by using the digital elevation model (DEM) of the study location, and the DEM of the B1 was generated by using a topographic map of Liudaogou basin which was drawn in 1981. Where topography gradually varies with time, we updated the altitudinal data at some places where the topography changed apparently by leveling and GPS survey. Due to each branch at the left side of the main channel was crossed by a road the actual hypothetical channel network of B1 basin is as Fig. 5c. b) Local observation The rainfall intensity was observed by an automatic rain gauge and the depth of water was recorded by a water level recorder, the two kinds of devices were installed in the upper reach of B1 basin (Fig. 5c). c) Profile leveling and cross sectioning To perform the discharge calculation with the observed data of the water level, the longitudinal slope of the river channel and the lateral profile of a section where the water level recorder was installed are both necessary. The gradient of the longitudinal profile was determined by profile leveling and the result is shown in Fig. 6. The gradient of a certain reach in which the water level recorder was installed was affirmed to 0.0234. The lateral profile was ascertained by cross sectioning as shown in Fig. 7. Time (d) Fig. 8 Calculated result of the intensive rainy events Table 1 Result of runoff calculation (10-22 Aug. 2004) Date Rain last (min) Rainfall (mm) Max. intensity (mm/5min) Max. discharge (m3/s) Runoff (m3) Runoff percentage (%) 11 60 18.4 3.6 0.366 306.7 18.0 14 1550 42.0 0.8 0.015 125.5 3.2 21 25 19.4 9.4 1.08 500.7 27.8 22 75 38.0 6.4 1.33 965.6 27.4 respectively shown in Fig. 8a-Fig. 8d. Analyzed the relation between the precipitation and the occurrence of the surface flow of each intensive rainy event as Fig. 8 shows, the relevant results such as the rainfall, the maximum rainfall We assumed the topsoil was saturated after the rainfall of 22.6 mm was infiltrated, as the porosity of the topsoil in Liudaogou basin is almost around 0.306), the thickness of the topsoil could be approximately estimated to be 8.0 cm. For a typical instance of the short-last heavy rain which happened on August 22, the mean rainfall intensity reached to 2.53 mm/5min and the runoff percentage attained 27.4 %. The runoff occurred immediately with the rainfall intensity of 2.6 mm/5min after the rainfall happened. Similarly, the runoff also occurred with the same rainfall intensity of another rainy event happened on August 11 (Fig. 8a). Consequently, the surface flow would occur by the rainfall intensity of 3 mm/5min (1.0×10⁻⁵ m/s) when the topsoil is in unsaturated situation. Additionally, based on the considered result as above, we can understand the runoff percentage of the short-last heavy rain is higher than the long-last light rain. 1 2 3 4 6 8 10 5 11 7 9 Road Fig.9 Hypothetical channel network of upstream of B1 Evapotranspiration (loss) Rainfall Infiltration The 2nd layer (15 m) Infiltration The 1st layer ( 10 cm) q0 q 4. RUNOFF CALCULATION TECHNIQUE Fig. 10 Lateral profile of the runoff calculation model intensity, the maximum discharge and the runoff percentage (et al) are shown in Table 1. (3) Consideration of the relation between the typical rainfall and the runoff occurrence Aiming at seeking the relation between the rainfall intensity and occurrence of the surface flow, we selected two typical rainy events which can be respectively regarded as a long-last light rain (Aug. 14) and a short-last heavy rain (Aug. 22), the rainfall and occurrence of the surface flow of each rainy event is respectively shown in Fig. 8b and Fig. 8d. In the case of a long-last light rainy event occurred on August 14, the rain lasted about 26 hours with the mean rainfall intensity of 0.14 mm/5min and the maximum intensity was 0.8 mm/5min. Though the total rainfall attained 42.0 mm, due to the weak rainfall intensity, the main part of the total was infiltrated and the runoff percentage was only 3.2 % which was considerably low. The surface flow occurred at the point of 14 hours 50 minutes after rain started. Because the topsoil was unsaturated the rainfall of 22.6 mm was infiltrated into the soil before the runoff occurred. Thus the stable infiltration velocity of the topsoil approximates to 2.7×10⁻⁶ m/s (0.8 mm/5min) even slightly more than this value, and the infiltration velocity of subsequent layer is less than this value, which could be affirmed. -4- Conventionally, a runoff analysis technique, which was constructed by kinematic wave theory and by using the hypothetical channel network, was regarded as a type of runoff calculation model that has extensive applicability. This type of runoff calculation model has been preferably developed in Japan and has been already examined applicable to different-scale basins so far. In the current study, in order to estimate the annual runoff of the study location, we also constructed the runoff calculation model for the study basin by kinematic wave theory and examined its applicability. (1) Hypothetical channel network of the region of local observation The generated hypothetical channel network of the upstream of B1 basin (end of the water level recorder installed spot) is shown in Fig. 9. (2) Runoff calculation model7), 8) Based on the considered method of kinematic wave model, we developed a runoff calculation model by considering the actual ground condition of the study basin (Fig. 4). As the thickness of the topsoil was about 8.0 cm, the thickness of the first layer of the slope sector was approximately assumed to be 10 cm. There are still some points such as the infiltration velocity and thickness of the subsequent layer have not been clarified. As there is a comparatively stable groundwater runoff which exists on the sandstone occurs at the downstream, and the distance between this groundwater runoff Table 2 Main parameters Simulation of rainfall and the surface flow Initial depth of water Porosity sm-1/3 m/s 3 m/s m/s m 0.80 0.0 0.60 2.0 0.40 4.0 rainfall o-flow c-flow 0.20 6.0 1:00 0:30 0:00 23:30 23:00 22:30 22:00 21:30 21:00 20:30 20:00 0.00 19:30 0.10 0.08 1.2×10⁻⁵ 4.5×10⁻⁸ 3.0×10⁻⁶ 4.0×10⁻⁷ 1.2×10⁻⁸ 0.10 15.0 0.0 …… 0.30 Discharge (m /s) Coefficient permeability10) (horizontal) Infiltration velocity (vertical) Loss coefficient Thickness Slope Channel 1st layer 2nd layer 1st layer 2nd layer …….. 1st layer 2nd layer 1st layer 2nd layer 1st layer Rainfall(mm/5min) 11 Aug. 2004 Coefficient roughness 8.0 Time (a) Runoff simulated result of 11 August 2004 m …… Simulation of rainfall and the surface flow ⎧ β = f2 ( λ h / ∆t ≥ f 2 ) ⎪ ∂h ∂q + = f 1 − β ⎨ β = λ h / ∆t ( λ h / ∆ t < f 2 ) λ ∂t ∂x ⎪ β =0 ( h = 0) ⎩ (3) Darcy’s law: q = kIh (4) Where, λ: effective porosity, h : Depth of the groundwater flow (m), q : discharge of the unit width of the groundwater (m2/s), k: coefficient of permeability (m/s), I : gradient of the 1st layer. Towards the runoff calculation in the slope sector, the direction of the surface flow corresponds to the steepest slopedown direction9), and as the thickness of the 1st layer is uniform, therefore the gradient of -5- 2.40 0 1.80 5 10 1.20 15 2:00 0:30 0:00 23:30 23:00 22:30 22:00 21:30 21:00 20:30 20:00 1:30 0.60 1:00 rainfall o-flow c-flow 0.00 20 Time (b) Runoff simulated result of 21 August 2004 Fig. 11 Runoff simulated result Runoff calculated result of B1 basin (May 21-Nov.10, 2006) 50000 0 40000 5 30000 10 20000 15 10000 20 rainfall Accumulative runoff Rainfall (mm/15min) 3 Accumulative runoff (m ) 25 11/10 10/28 10/14 10/1 9/18 9/4 8/22 8/9 7/27 7/13 6/30 6/17 6/3 0 5/21 (3) Basic equations To perform the runoff calculation with the constructed runoff model, the slope sector and the river channel sector were separated, while the surface flow and the groundwater flow were respectively calculated7), 8). The basic equations are as follows: a) The slope sector Equation of continuity of the surface flow: (h / ∆t ≥ f1 ) ⎧ α = f1 ∂h ∂q ⎪ (1) + = r − α ⎨α = h / ∆t (h / ∆t < f1 ) ∂t ∂x ⎪ α =0 (h = 0) ⎩ Manning’s mean velocity equation: 2 1 1 (2) q = hR (h) 3 I 2 n Where, h: depth of water (m), q: unit width flow rate (m2/s), x: distance in flow direction (m), ∆t : interval of calculation (s), r: the effective rainfall (m/s), f1, f2: infiltration velocity of the 1st and the 2nd layer (m/s), n: coefficient of the roughness (m-1/3), R: hydraulic radius (m), I: gradient of the slope. Equation of continuity of the groundwater (the 1st layer): Discharge(m3/s) and the ground is about 15 m, we developed the runoff calculation model as shown in Fig. 10. Rainfall(mm/5min) 21 Aug. 2004 Date Fig. 12 Accumulative runoff of the surface flow of B1 the slope is adopted to perform the calculation both the surface flow and the groundwater flow in the first layer. The gradient of the slope is determined by using the DEM9). The gradient of the second layer is also adopted the same value as the first layer, and the groundwater in the second layer has no impact on calculation of the surface flow. b) The river channel sector The basic equations for runoff calculation of the river channel sector are the same as the slope sector, however there are some differences in forms according to the actual condition of the river channel. For instance, for the calculation of the surface flow, an item of the inflow from the slope sector must be added in equation (1), and for the groundwater flow, the inflow from the slope sector should be added in equation (3). (4) Determination of some main parameters The necessary parameters for the runoff calculation must be determined. Generally, there is no flow in the river channel except when comparative intensive rainfall occurs, and the surface flow is usually short-lived after the rain is over. Inevitably, the initial condition of the first layer has deep influence on occurrence of the surface flow. Meanwhile the situation of the second layer has no impact unless the long-last rainfall occurs. As the parameters of the second layer were deficient, thereby the determined method for the necessary parameters is as following. Initially, we affirmed every parameter of the first layer as shown in Table 2. Then, we calculated the discharge by using the observed water level data and the relevant result was regarded as accurate value which was named by the observed-flow. In the next step, each parameter of the second layer such as f2 was assumed by experience. Then we performed the runoff calculation by using the constructed calculation model with these assumed parameters and the achieved result was called as the calculated-flow. To lessen the difference between the observed-flow and the calculated-flow, we adjusted the relative parameters of the second layer and repeated the runoff calculation many times. Finally, a certain group parameter, by which the minimum difference of all the calculated results was produced, was adopted as the rational value (Table 2). (5) Applicability examination The applicability of runoff calculation model was examined by numerical simulation of the observed-flow. The simulated results of the typical rainy events were shown in Fig. 11. According to these results, we could understand the constructed runoff calculation model is applicable to the actual condition of the study basin. 5. RUNOFF CALCULATION The calculated area is B1 basin (Area: 0.43 km2, catchment area: 0.22 km2). The calculation time was from May 21 to November 10, 2006 which embodied the whole rainy season of the study location. The total rainfall was 324.0 mm during the considered period and the total precipitation was estimated to be 1.40×10⁵ m3 in B1 basin. The result of the runoff calculation is shown in Fig. 12. Based on the calculated result, the total runoff occurred in B1 basin was estimated to be 2.54×10⁴ m3 thereby the runoff percentage of the surface flow was about 18 % during the calculation time. Because there was no surface flow occurred except the considered time in 2006, the annual runoff percentage may be inferred to be about 15 % with annual rainfall of 400 mm. -6- 6. CONCLUSIONS For the topsoil, the stable infiltration velocity is approximately 3.0×10⁻⁶ m/s and the thickness is around 8 cm. For the runoff characteristics, (a) There is no occurrence of the surface flow except during the occurrence of intensive rainfall. (b) Generally, the runoff percentage of the short-last heavy rain is higher than the long-last light rain. (c) The surface flow would occur if the rainfall intensity attains 3 mm/5min. (d) Annual runoff percentage of the rainfall is about 15 %. Particularly, the runoff calculation model constructed by kinematic wave theory is applicable to the calculation of the surface flow of the upstream region in Loess Plateau. ACKNOWLEDGMENT: We would like to express a deep gratitude to cooperators in Institute of Soil and Water Conservation (ISWC) of China. REFERENCES (1) Xu, X. Zh., Zhang, H. W. and Zhang, O. Y.: Development of check-dam systems in gullies on the Loess Plateau, China, Environmental Science & policy, 7(2004) 79-86. (2) Zheng, J. Y.: Study on the infiltration and redistribution of soil water and the spatial variation of soil hydraulic properties in water-wind erosion crisscross, Institute of Soil Science, CAS, China, S152.7, UCD 631.43, pp. 1-20, 2004. (3) Wu, P. T. and Wang, Y. K.: High effective water utilized technique for constructing vegetation with forest and grass in Loess Plateau, The Northwest A&F Press, pp. 1-10, 2002. (4) Kimura, R., Bai, L., Fan, J. Takayama, N. and Hinokidani, O.: Evapo-transpiration estimation over the river basin of the Loess plateau of China based on remote sensing, Journal of Arid Environments, 68(2007) 53-65. (5) Fan, J.: Study on the soil water dynamics and modeling in water-wind erosion crisscross region on the Loess Plateau, Institute of Soil Science, CAS, China, S152.7, UCD 631.43, pp. 30-45, 2005. (6) Jiang, N. and Shao, M. A.: Spatial variability of soil infiltration properties on natural slope in Liudaogou catchment on Loess Plateau, Journal of Soil and Water Conservation China, Vol. 19, No. 1, 2005. (7) Hashimoto, N., Fujita, A., Shiiba, M., Tachikawa, Y. and Ichikawa, Y.: Development of dam inflow prediction system based on distributed rainfall-runoff model, Annual Journal of Hydraulic Engineering, JSCE, Vol. 50, pp. 289-294, 2006. (8) Kobayashi, K., Tachikawa, Y., Sayama, T. and Takara, K.: Analysis of the Yuragawa-river flood by typoon No. 23 in October 2004 using distributed rainfall-runoff model, Annual Journal of Hydraulic Engineering, JSCE, Vol. 50, pp. 313-318, 2006. (9) Tarboton, D. G.: A new method for the determination of flow directions and upslope area in grid digital elevations models, Water Resour. Res., 33(2), pp. 309-319, 1997. (10) Takeo, M.: Soil mechanics, The Gihodo Press., Japan, pp.104, 1982. (Received September 30, 2007)


