Document 14580507

MEASUREMENT OF STRAIGHTNESS OF A WIRE AFTER ROTATING STRAIGHTENING
USING A COORDINATE MEASURING MACHINE
G. Kreiseler
1
, J. Siegert
1
, E. Westkämper
1
1
University of Stuttgart, Institute of Industrial Manufacturing and Management (IFF), Germany, gzk@iff.uni-stuttgart.de
Abstract: Straightening is a process used in various applications in production. It is used from large applications such as railway tracks down to very small applications like straightening wire before it is turned into springs for watches. Straightening can be used on sheet metal, profiles or wire. In order to straighten wire, roller straightening is mostly used, but rotating straightening achieves straightening results of higher quality. In this paper the basics functionality of the rotating straightening will be explained and an overview of different approaches on how to measure straightness will be given. Then the approach used for research at the IFF will be shown. The method of measurement takes into account that information is needed to evaluate the straightening process. The method is explained in detail and different approaches for measuring are compared. Finally, results from first measurements are shown and evaluated.
Key words: rotating straightening, straightness, coordinate measuring machine the output wire has to be described. The main characteristic taken into account for this evaluation is straightness. In a first step, different approaches of defining straightness are evaluated, in a second step, a working definition for the research has to be found, and there has to be a measuring strategy for that.
2. ROTATING STRAIGHTENING
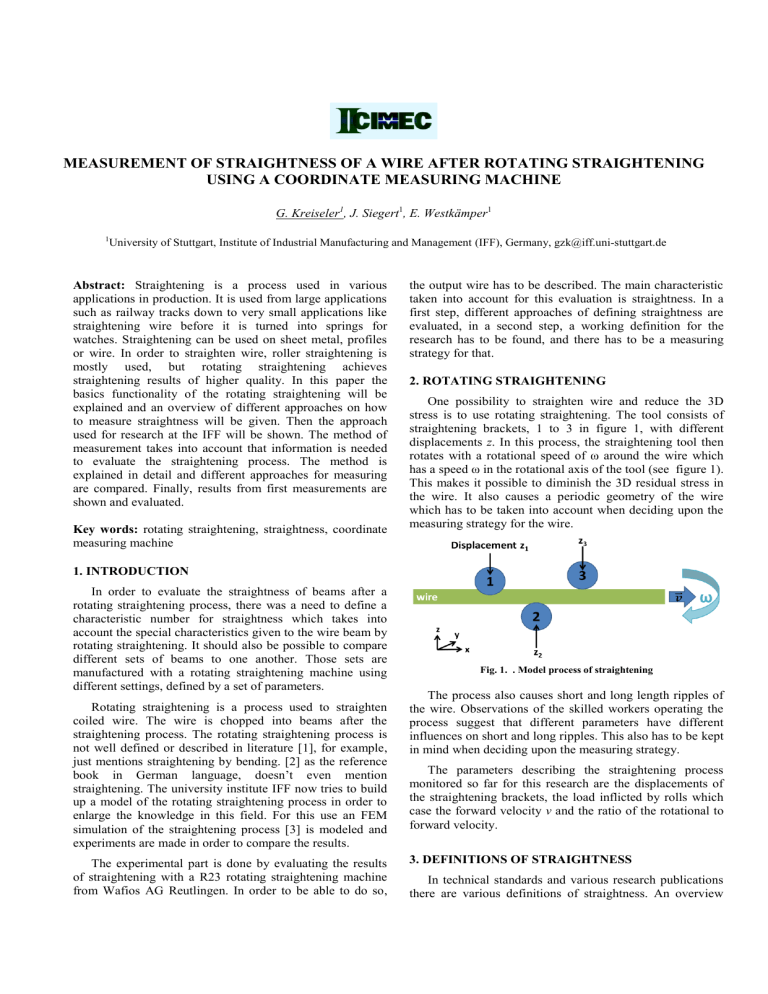
One possibility to straighten wire and reduce the 3D stress is to use rotating straightening. The tool consists of straightening brackets, 1 to 3 in figure 1, with different displacements z . In this process, the straightening tool then rotates with a rotational speed of ω around the wire which has a speed ω in the rotational axis of the tool (see figure 1).
This makes it possible to diminish the 3D residual stress in the wire. It also causes a periodic geometry of the wire which has to be taken into account when deciding upon the measuring strategy for the wire.
1. INTRODUCTION
In order to evaluate the straightness of beams after a rotating straightening process, there was a need to define a characteristic number for straightness which takes into account the special characteristics given to the wire beam by rotating straightening. It should also be possible to compare different sets of beams to one another. Those sets are manufactured with a rotating straightening machine using different settings, defined by a set of parameters.
Rotating straightening is a process used to straighten coiled wire. The wire is chopped into beams after the straightening process. The rotating straightening process is not well defined or described in literature [1], for example, just mentions straightening by bending. [2] as the reference book in German language, doesn’t even mention straightening. The university institute IFF now tries to build up a model of the rotating straightening process in order to enlarge the knowledge in this field. For this use an FEM simulation of the straightening process [3] is modeled and experiments are made in order to compare the results.
The experimental part is done by evaluating the results of straightening with a R23 rotating straightening machine from Wafios AG Reutlingen. In order to be able to do so,
Fig. 1. . Model process of straightening
The process also causes short and long length ripples of the wire. Observations of the skilled workers operating the process suggest that different parameters have different influences on short and long ripples. This also has to be kept in mind when deciding upon the measuring strategy.
The parameters describing the straightening process monitored so far for this research are the displacements of the straightening brackets, the load inflicted by rolls which case the forward velocity v and the ratio of the rotational to forward velocity.
3. DEFINITIONS OF STRAIGHTNESS
In technical standards and various research publications there are various definitions of straightness. An overview
will be given below, leading to the description of the definition used for the presented research.
3.1. Definitions up till now
In [4] there is a default definition for cylinders which is the closest to the geometry of the beam. It defines the middle axis of the cylinder as well as the diameter. The tolerances for this default definition are given in [5]. For the evaluation, the deviance can be evaluated or the distance between the minimum circumscribed circle and the maximum inscribed circle (dashed lines in figure 2). Also there can be an evaluation following Gauss of the minimum circumscribed circle and the maximum inscribed circle [6].
As the rotating straightening results in periodic characteristics of the beam, the measuring does not have to be in very small steps all along the beam. There are smaller steps at the beginning of the beam and larger steps following. First, there are eleven points with a distance of
1 mm followed by nine measurement points with a distance of 10 mm and then five points in 50 mm steps (figure3).
Fig. 2. Default definition according to [4]
Fangmeier [7] defines straightness as the maximal deviation of a beam rotated between two bearings. The deviation is measured in the exact middle between the two bearings. This definition can be used when only the maximum deviation for a beam is of interest. One of the applications for this definition is railway tracks. It can be hard to find the exact middle position. There are conversions for measurements at other positions in [7].
Dutschke und Walter [8] measure different points along a cylinder with the help of small steel plates and measure the radial distance to the default cylinder. Here, the cylinder is also rotated to evaluate concentric runout. The minimum width of the steel plates is one of the boundaries of this measurement technique.
3.2. Definition for this research
Dutschke’s and Walter’s way to measure straightness is the closest to the needs for this research. Today, it is possible to measure in a similar way with a coordinate measuring machine which is able to measure 3D coordinates. For that, the beam does not have to be rotated.
Also the optical measuring device of the multisensor coordinate measuring machine is able to measure in a small window and thus the width of the measuring point should not impose a problem.
Fig. 3. Measurement points along the wire
The results of the measurements of these points are then evaluated with a characteristic number which will be called
Ra, because it follows the Ra number used to characterize surfaces.
Ra
1 n n i
1
( y i
y )
2
( z i
z )
2
(1)
Ra is a measure for the distance to the average values. y i and z i
are the measured values, the ¯ values are the arithmetic mean values and n is the number of measurement points. This Ra is calculated for the three different step sizes separately. For the first eleven points Ra_short is calculated, for the 10 mm distance steps Ra_ middle is calculated, and for the 50 mm steps Ra_long.
After measuring the data is evaluated using a Matlab routine in order to assess the straightness of the beams. The data is given in the format: diameter, x_1, y_1, z_1, x_2, y_2, z_3 … z_n for the first beam, followed by the second beam and so on. The routine reads all the data, sorts then in beams and then into 3D coordinates. After being sorted the data has to be corrected by the bowing under load. After the pre-processing of the data the Ra values can be calculated and are given as output data to evaluate the different settings of the R23.
4. MEASUREMENTS
The measuring takes place at the IFF using a Werth
VideoCheck HA 400x400 in a measurement room class one.
The measurements are performed with the optical measuring device using the autofocus function. Before the beams are measured, they are stored in the measuring room for at least a day in order to adjust to the ambient temperature of
20°C ± 0.1 °. Before being measured they are cleaned to prevent dirt particles from influencing the measurements.
In a first pre-run measurements were performed on three points given in figure 4. First, two points (1 and 2 in figure 4) at either side of the wire were measured with transmitted light and a magnification of seven. The autofocus function was used to measure the position of the edge of the wire. Then the measuring software calculated the middle of the wire, and then, based on this data, the top of the wire (3 in figure 4) is measured with the autofocus function and a magnification of ten. For this transmitted light cannot be used, so it was replaced by incident light.
Before starting the measurement program, in an interface the occupied positions in the device can be selected (figure
6, checked boxes on the right). The program then starts with the first beam in the device and measures all the points along the beam and goes on with the following beams. The results are then saved in an ASCII –file and evaluated as explained in section 3.2.
Fig. 4. measurement points on wire
Afterwards these results were compared to measuring only one side of the wire (1 or 2 in figure 4). For that transmitted light and a magnification of seven was used. The differences in the results for Ra were in the range of the uncertainty of measurements.
Table 1. comparison three to one measurement
Ra mean [m] std [m] short 3 point
1.80796E-05 2.5693E-07 middle 3 point
0.000147916 2.0125E-07 long 3 point
0.00021348 2.3204E-07 short 1 point
1.83726E-05 3.6311E-07 middle 1 point
0.000145203 6.2428E-07 long 1 point
0.000213211 7.1579E-07
For each of the two methods there were 25 measurements and the evaluation was performed with a
Matlab routine which takes into account bending under load.
After the procedure of measurement was decided upon, a device (figure 5) was built in order to be able to measure several beams after one another. On the left side there is a mechanical stop and on the other side a loose bearing. The two sides are connected with the beam not shown in figure
5. The distance of the two bearings is 0.3575 m. This makes it possible to measure all the points given in figure 3.
Fig. 6 device for measurements
Other details that can be selected in the interface of the measuring program (figure 6) are: which experiments have taken place, what is the name of the sample and should there be a picture taken of every single measurement point. Those pictures make it possible, to evaluate discordant values, which are caused by small dirt particles on the beams. Also there is a section for adding comments to the ASCII-file.
Fig. 5 device for measurements
5. FIRST RESULTS
First measurements have been carried out at the IFF.
Since they are going to be used to evaluate settings of the
R23 straightening machine from Wafios AG, the ability of the process had to be evaluated. For that purpose, there were three sample sets of 99 wire beams each. For each set the same parameters from section 2 describing a setting were used. They were evaluated as given in the previous.
First, there was a test on normal distribution with the statistical software Minitab. For each of the three sets the normal distribution of the Ra_short, middle and long values was evaluated. The p values for the test were widely distributed between under 0.005 and 0.940. All p values are given in the following table.
Table 2. p values for normal distribution
V1
V2
V3 short
< 0.005
< 0.005
< 0.005 middle
0.940
0.653
< 0.005 long
< 0.005
0.425
0.009
As shown in table 2, the tests on normal distribution showed that it is unlikely that the Ra values are normally distributed. Since the monitored parameters of straightening for those beams were always the same, the conclusion can be drawn that there are more parameters influencing the straightening results than monitored. This is confirmed by the visual inspection of the box-plots (figure 7-9) of the results.
The median and the standard deviation are clearly very different for the three test runs. This leads to the conclusion that not only the process for one setting floats, but also that the accuracy of setting or the monitored parameters for the settings are not sufficient to describe the straightening process.
This is also shown by an evaluation following Mann-
Whitney [9], which did not show that the distributions of the different sets were similar.
Fig. 7. box-plots short
6. CONCLUSION
It was shown how straightness can be defined in order to be able to describe straightened wire. One of the main goals of the measurement strategy was to be able to compare different settings of the straightening machine to one another. The measurements described in section 4 and 5 of this paper show clearly that conclusions can be made with the Ra values defined in section 3. The results also show, that the monitored settings are not sufficient for describing the process and that there have to be further efforts to find parameters adequately describing the straightening process.
REFERENCES
Fig. 8. box-plots middle
Fig. 9. box-plots long
In the box-plots the cross in the middle shows the median and the lines the standard deviation. On the horizontal axes there are the different sets with the different characteristic numbers. On the vertical axis there is the Ra value in µm.
[1] Lange, Kurt: Umformtechnik. : Handbuch für Industrie und Wissenschaft Blechbearbeitung. Blechbearbeitung .
2., völlig neubearb. und erw. Aufl. 4 Bände. Berlin:
Springer (3) 1990
[2] Grote, Karl-Heinrich; Feldhusen, Jörg; Dubbel , Heinrich
2007
[3] G. Kreiseler, J. Siegert, E. Westkämper , Modelling and measurment techniques for wire straightening machines. in publication at the 21st International Conference on
Production Research in Stuttgart, Germany
[4] DIN EN ISO 14660-2
[5] DIN EN ISO 1101
[6] Keferstein, Claus P. ; Dutschke, Wolfgang:
Fertigungsmesstechnik. Praxisorientierte Grundlagen, moderne Messverfahren 6. Auflage, Teubner 2008
[7] Fangmeier R.: Geradheit beim Richten von Blankstahl ,
Stahl und Eisen 96 (1976) 18.
[8] Dutschke W.; Walter W.: Geradheitsabweichungen der
Mantellinie zylindrischer Werkstücke , QZ 23(1978) 9.
[9] Rinne H. : Taschenbuch der Statistik, 4. Auflage Verlag
Harri Deutsch 2008


