2339.pdf 18th IAA Humans in Space Symposium (2011)
advertisement
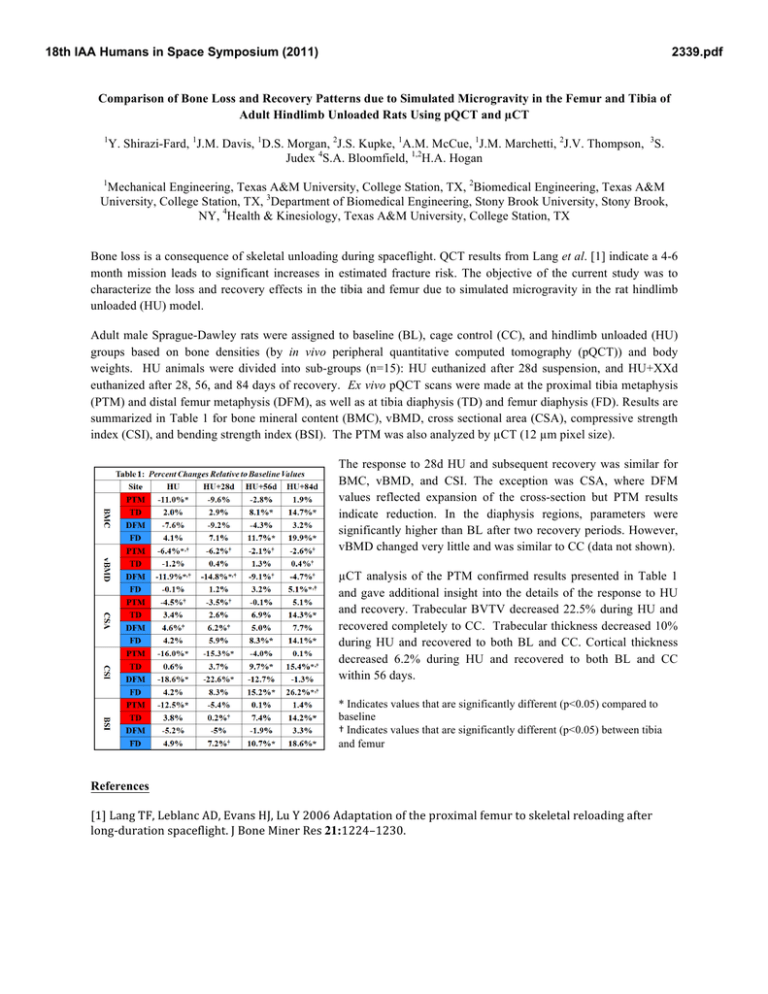
18th IAA Humans in Space Symposium (2011) 2339.pdf Comparison of Bone Loss and Recovery Patterns due to Simulated Microgravity in the Femur and Tibia of Adult Hindlimb Unloaded Rats Using pQCT and µCT 1 Y. Shirazi-Fard, 1J.M. Davis, 1D.S. Morgan, 2J.S. Kupke, 1A.M. McCue, 1J.M. Marchetti, 2J.V. Thompson, 3S. Judex 4S.A. Bloomfield, 1,2H.A. Hogan 1 Mechanical Engineering, Texas A&M University, College Station, TX, 2Biomedical Engineering, Texas A&M University, College Station, TX, 3Department of Biomedical Engineering, Stony Brook University, Stony Brook, NY, 4Health & Kinesiology, Texas A&M University, College Station, TX Bone loss is a consequence of skeletal unloading during spaceflight. QCT results from Lang et al. [1] indicate a 4-6 month mission leads to significant increases in estimated fracture risk. The objective of the current study was to characterize the loss and recovery effects in the tibia and femur due to simulated microgravity in the rat hindlimb unloaded (HU) model. Adult male Sprague-Dawley rats were assigned to baseline (BL), cage control (CC), and hindlimb unloaded (HU) groups based on bone densities (by in vivo peripheral quantitative computed tomography (pQCT)) and body weights. HU animals were divided into sub-groups (n=15): HU euthanized after 28d suspension, and HU+XXd euthanized after 28, 56, and 84 days of recovery. Ex vivo pQCT scans were made at the proximal tibia metaphysis (PTM) and distal femur metaphysis (DFM), as well as at tibia diaphysis (TD) and femur diaphysis (FD). Results are summarized in Table 1 for bone mineral content (BMC), vBMD, cross sectional area (CSA), compressive strength index (CSI), and bending strength index (BSI). The PTM was also analyzed by µCT (12 µm pixel size). The response to 28d HU and subsequent recovery was similar for BMC, vBMD, and CSI. The exception was CSA, where DFM values reflected expansion of the cross-section but PTM results indicate reduction. In the diaphysis regions, parameters were significantly higher than BL after two recovery periods. However, vBMD changed very little and was similar to CC (data not shown). µCT analysis of the PTM confirmed results presented in Table 1 and gave additional insight into the details of the response to HU and recovery. Trabecular BVTV decreased 22.5% during HU and recovered completely to CC. Trabecular thickness decreased 10% during HU and recovered to both BL and CC. Cortical thickness decreased 6.2% during HU and recovered to both BL and CC within 56 days. * Indicates values that are significantly different (p<0.05) compared to baseline † Indicates values that are significantly different (p<0.05) between tibia and femur References [1] Lang TF, Leblanc AD, Evans HJ, Lu Y 2006 Adaptation of the proximal femur to skeletal reloading after long‐duration spaceflight. J Bone Miner Res 21:1224–1230.
