Introduction (Investigation using Graphs) EXPLORING INSTANTANEOUS RATES of CHANGE
advertisement

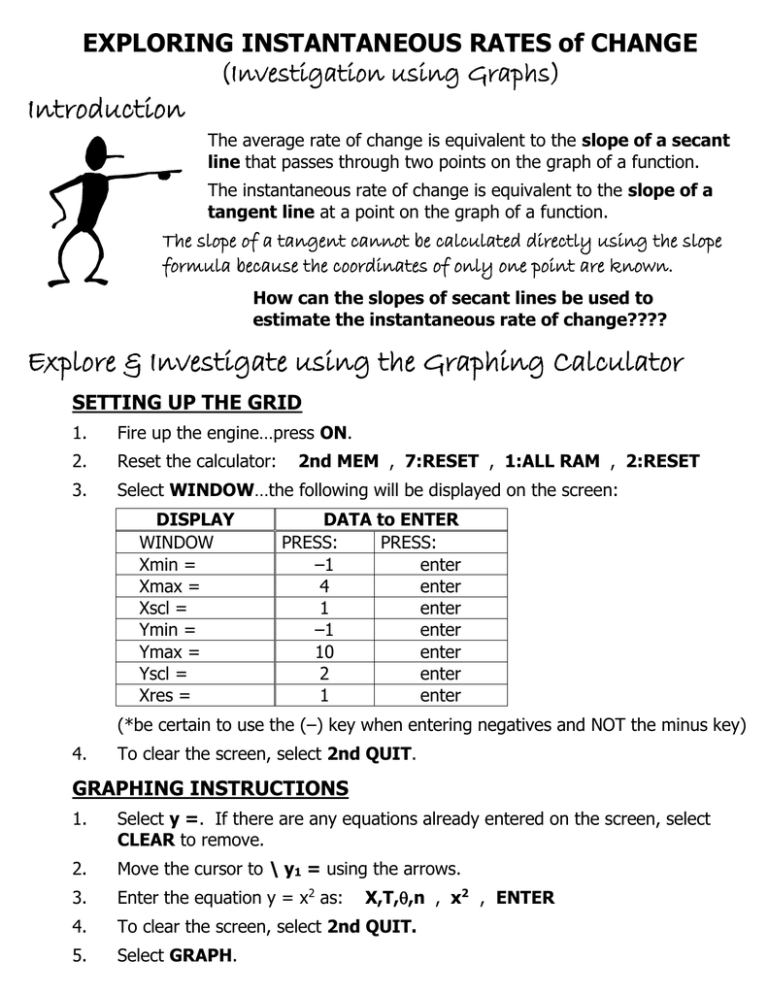
EXPLORING INSTANTANEOUS RATES of CHANGE (Investigation using Graphs) Introduction The average rate of change is equivalent to the slope of a secant line that passes through two points on the graph of a function. The instantaneous rate of change is equivalent to the slope of a tangent line at a point on the graph of a function. The slope of a tangent cannot be calculated directly using the slope formula because the coordinates of only one point are known. How can the slopes of secant lines be used to estimate the instantaneous rate of change???? Explore & Investigate using the Graphing Calculator SETTING UP THE GRID 1. Fire up the engine…press ON. 2. Reset the calculator: 3. Select WINDOW…the following will be displayed on the screen: DISPLAY WINDOW Xmin = Xmax = Xscl = Ymin = Ymax = Yscl = Xres = 2nd MEM , 7:RESET , 1:ALL RAM , 2:RESET DATA to ENTER PRESS: PRESS: –1 enter 4 enter 1 enter –1 enter 10 enter 2 enter 1 enter (*be certain to use the (–) key when entering negatives and NOT the minus key) 4. To clear the screen, select 2nd QUIT. GRAPHING INSTRUCTIONS 1. Select y =. If there are any equations already entered on the screen, select CLEAR to remove. 2. Move the cursor to \ y1 = using the arrows. 3. Enter the equation y = x2 as: 4. To clear the screen, select 2nd QUIT. 5. Select GRAPH. X,T,,n , x2 , ENTER Exercise Draw a sketch of the graph on the grid given below: y 10 8 6 4 2 0 1 2 3 4 5 x Exercise Draw a secant line that passes through the points (1,1) and (3,9). Exercise Calculate the slope of the secant line. Exercise Calculate the slopes of other secant lines using the points listed: Points (x1, y1) (1,1) (1,1) (1,1) (1,1) (1,1) (1,12) Exercise Slope of Secant (x2, y2) (3,9) (2, ) (1.5, ) (1.1, ) (1.01, ) 4 (x,x2) Create a formula for calculating the slope of any secant line that passes through (1,1) and the general point, (x,x2). CREATING A TABLE OF VALUES 1. Select y =. CLEAR the equation from \ y1 =. 2. Enter the formula from exercise into \ y1 = and 2nd QUIT. (NOTE: use brackets around each part of the expression) 3. Select 2nd TBLSET. Cursor to Indpnt: Ask. Select ENTER and 2nd QUIT. 4. Select 2nd TABLE. Enter 3 in the x column and select ENTER. The slope should appear in the y column. Check it with the value obtained for the point (3,9) from exercise . 5. Continue entering the values of x from exercise and checking the slope values against the calculated values. 6. Draw all 5 secant lines on the graph created in exercise . Exercise Examine the graph drawn in exercise . Describe what is happening to the secant lines as the points get closer to the fixed point, (1,1). Examine the table of secant slopes in exercise . Describe what is happening to the slopes as the points get closer to the fixed point, (1,1). DRAWING THE TANGENT LINE at the FIXED POINT 1. Select y =. CLEAR the equation from \ y1 =. 2. Enter y = x2 into \ y1 = and 2nd QUIT. Select GRAPH. 3. Select 2nd DRAW. Select 5: Tangent. 4. Enter 1 and select ENTER. The tangent line should appear on the graph. 5. Record the equation of the tangent line (bottom left corner of the screen). Equation of the tangent line: ____________________________ Slope of the tangent line: __________ !!! How does this slope compare to the pattern observed in the secant lines??? SUMMARY: As a point moves closer to the point of tangency, the slope of the secant line through that point approaches the slope of the tangent line. Example p.91 #1a) f(x) = 3x2 – 5x + 1 Use the slopes of secant lines to estimate the slope of the tangent line when x = 2. Fixed Point (x1,y1) x=2 Variable Point (x2,y2) Slope of Secant (2.5, ) (2.1, ) (2.01, ) (1.99, ) (1.9, ) (1.5, ) the slope of the tangent line at x = 2 is approximately __________ ! Homework: p.91– 92 #1c, 4


