Washington, DC Metropolitan Area Housing Monitor—Second Quarter 2012
advertisement

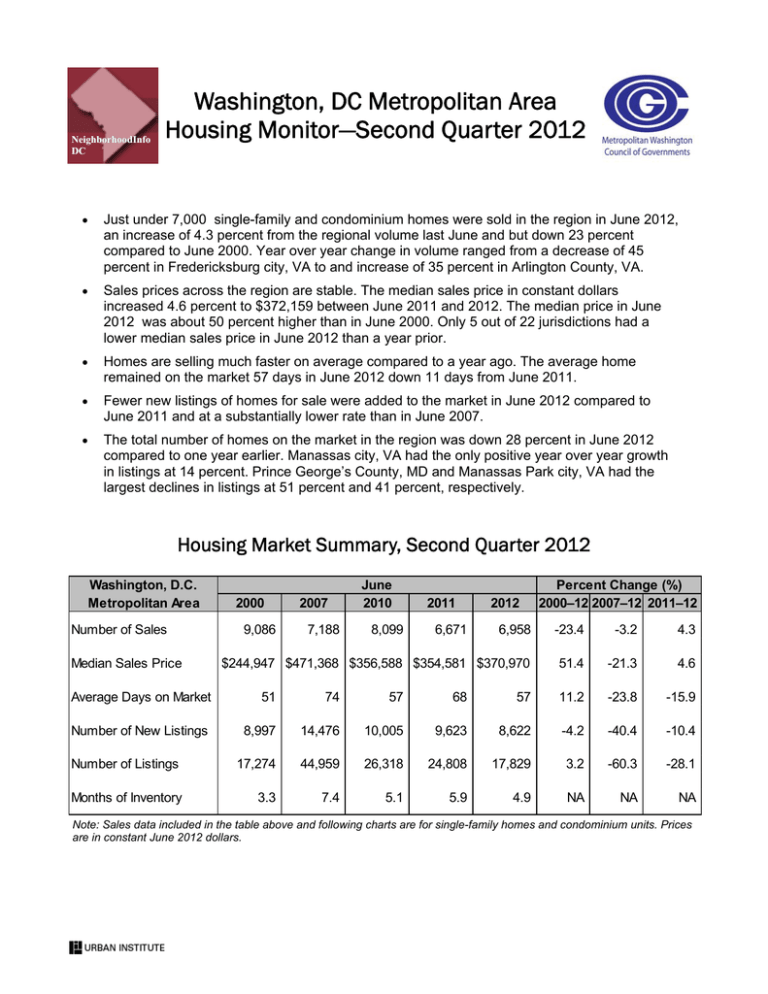
NeighborhoodInfo DC Washington, DC Metropolitan Area Housing Monitor—Second Quarter 2012 Just under 7,000 single-family and condominium homes were sold in the region in June 2012, an increase of 4.3 percent from the regional volume last June and but down 23 percent compared to June 2000. Year over year change in volume ranged from a decrease of 45 percent in Fredericksburg city, VA to and increase of 35 percent in Arlington County, VA. Sales prices across the region are stable. The median sales price in constant dollars increased 4.6 percent to $372,159 between June 2011 and 2012. The median price in June 2012 was about 50 percent higher than in June 2000. Only 5 out of 22 jurisdictions had a lower median sales price in June 2012 than a year prior. Homes are selling much faster on average compared to a year ago. The average home remained on the market 57 days in June 2012 down 11 days from June 2011. Fewer new listings of homes for sale were added to the market in June 2012 compared to June 2011 and at a substantially lower rate than in June 2007. The total number of homes on the market in the region was down 28 percent in June 2012 compared to one year earlier. Manassas city, VA had the only positive year over year growth in listings at 14 percent. Prince George’s County, MD and Manassas Park city, VA had the largest declines in listings at 51 percent and 41 percent, respectively. Housing Market Summary, Second Quarter 2012 Washington, D.C. Metropolitan Area Number of Sales Median Sales Price 2000 9,086 2007 7,188 June 2010 8,099 2011 6,671 2012 Percent Change (%) 2000–12 2007–12 2011–12 6,958 -23.4 -3.2 4.3 $244,947 $471,368 $356,588 $354,581 $370,970 51.4 -21.3 4.6 Average Days on Market 51 74 57 68 57 11.2 -23.8 -15.9 Number of New Listings 8,997 14,476 10,005 9,623 8,622 -4.2 -40.4 -10.4 Number of Listings 17,274 44,959 26,318 24,808 17,829 3.2 -60.3 -28.1 Months of Inventory 3.3 7.4 5.1 5.9 4.9 NA NA NA Note: Sales data included in the table above and following charts are for single-family homes and condominium units. Prices are in constant June 2012 dollars. 2 Washington, DC Metropolitan Area Housing Monitor—Second Quarter 2012 Total Sales Volume Remained Steady with Seasonal Fluctuations 50,000 Number—Three Month Rolling Average 45,000 Total Listings 40,000 Total New Listings 35,000 Total Sales 30,000 25,000 20,000 15,000 10,000 5,000 0 Home Sale Prices Increased in Recent Months Washington, DC Metropolitan Area Housing Monitor—Second Quarter 2012 Positive Year-Over-Year Sales Volume Prevalent Across the Region Data are not reported for ZIP codes with less than five sales. 3 4 Washington, DC Metropolitan Area Housing Monitor—Second Quarter 2012 Homes Sold Most Quickly in Virginia Suburbs Conventional Financing Increased and Cash and Government-Backed Mortgages Declined Washington, DC Metropolitan Area Housing Monitor—Second Quarter 2012 5 Conventional Financing More Prevalent in Inner Core and Inner Suburbs; More FHA and VA Financing in Outer and Far Suburbs *Other sales include assumption, owner-financed, and other sales. Contributors: Rebecca Grace, Leah Hendey, Peter Tatian, and Simone Zhang About NeighborhoodInfoDC: NeighborhoodInfo DC is a partnership between the Urban Institute and the Washington, DC Local Initiatives Support Corporation to provide community-based organizations and citizens in the District of Columbia and the Washington region with local data and analysis they can use to improve the quality of life in their neighborhoods. About the Metropolitan Washington Council of Governments (COG): COG is a regional organization comprised of 21 local governments surrounding our nation's capital, plus area members of the Maryland and Virginia legislatures, the US Senate, and the US House of Representatives. COG provides a focus for action and develops sound regional responses to such issues as the environment, affordable housing, economic development, health and family concerns, human services, population growth, public safety, and transportation. About Fannie Mae: This publication was funded through a grant from Fannie Mae. Fannie Mae exists to expand affordable housing and bring global capital to local communities in order to serve the US housing market. Fannie Mae has a federal charter and operates in America’s secondary mortgage market to enhance the liquidity of the mortgage market by providing funds to mortgage bankers and other lenders so that they may lend to homebuyers. About the Data: The Washington metropolitan region spans three states and the District of Columbia. For the analysis presented here, we have adopted the federal government’s 2008 definition of the Washington, DC metropolitan area. The counties included in each subarea are shown below. RealEstate Business Intelligence, LLC: The data on housing market activity for single-family homes and condominiums, including the volume and prices of home sales, average days on market, new and current listings, and months of inventory, are provided by RealEstate Business Intelligence, LLC. (RBI), a wholly-owned subsidiary of Metropolitan Regional Information Systems, Inc. "The Monthly Market Statistics—Detailed Report" is available through the RBI web site (www.rbintel.com) for all of the counties in the Washington, DC metropolitan area. All prices presented here have been adjusted for inflation and are in June 2012 dollars. Washington, DC Metropolitan Area Subareas For More Information: This document is available online at www.NeighborhoodInfoDC.org. The views expressed are those of the authors and should not be attributed to the Urban Institute, Metropolitan Washington Council of Governments, Fannie Mae, their trustees, or their funders.


