Document 14546909
advertisement

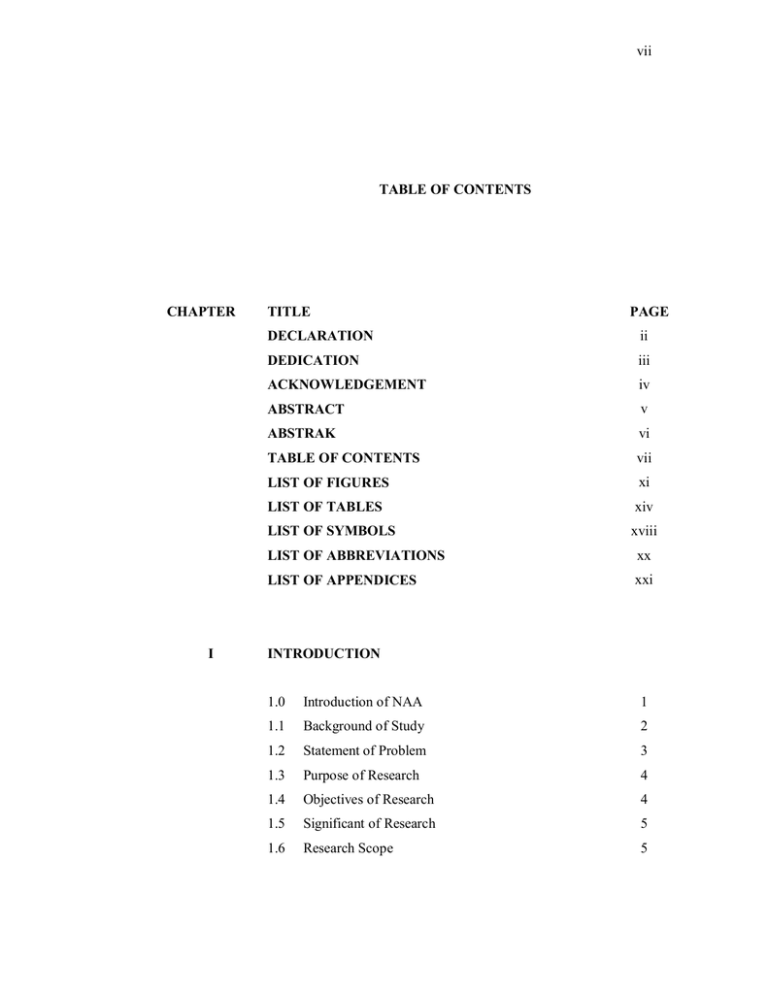
vii TABLE OF CONTENTS CHAPTER I TITLE PAGE DECLARATION ii DEDICATION iii ACKNOWLEDGEMENT iv ABSTRACT v ABSTRAK vi TABLE OF CONTENTS vii LIST OF FIGURES xi LIST OF TABLES xiv LIST OF SYMBOLS xviii LIST OF ABBREVIATIONS xx LIST OF APPENDICES xxi INTRODUCTION 1.0 Introduction of NAA 1 1.1 Background of Study 2 1.2 Statement of Problem 3 1.3 Purpose of Research 4 1.4 Objectives of Research 4 1.5 Significant of Research 5 1.6 Research Scope 5 viii II III LITERATURE REVIEWS 2.0 Introduction 7 2.1 Neutron Sources 8 2.2 Nuclear Reaction 10 2.3 The Trend of NAA 11 2.4.1 Relative Method 12 2.4.2 Ko- Standardization Method 13 THEORY 3.1 Neutron Activation Equations 15 3.2 HOGDAHL Reaction Rate 16 3.3 Non-ideal 1/E 1+á Epithermal Neutron Flux 17 Distribution 3.4 Determination of á and f parameter 19 3.4.1 The Cadmium ratio multi 20 monitor method 3.4.2 Error Analysis of á parameter IV 22 3.5 Epithermal and thermal neutron flux 24 3.6 Full-Energy Peak Detection Efficiency 28 METHODOLOGY 4.0 Introduction 32 4.1 TRIGA Puspati Reactor (RTP) 33 4.2 Gamma-ray Spectrometry 35 4.3 Calibration of gamma ray spectrometer 36 4.4 Determination of reactor neutron spectrum 38 parameters 4.5 Analysis of Environmental reference materials 40 ix V RESULT AND DISCUSSION 5.0 Introduction 42 5.1 Calibration of Detector Efficiency 42 5.2 5.1.1 Ortec Detector Calibration 43 5.1.2 Canberra Detector Calibration 48 Result of á by the Cd ratio 5.2.1 Result of á at Irradiation 54 54 Position 10 5.2.2 Result of á at Irradiation 57 Position 22 5.2.3 Result of á at Irradiation 58 Position 27 5.2.4 Result of á at Irradiation 60 Position 31 5.3 Calculation of Thermal to Epithermal Flux 62 Ratio 5.4 Thermal and Epithermal Neutron Flux 63 Results 5.5 HOGDAHL Reaction Rate for Irradiated 65 Elements 5.6 Elemental Analysis Using NAA Absolute 70 Method VI CONCLUSION 6.0 Conclusion 89 6.1 Recommendation 90 x REFERENCES 91 APPENDIX A 95 APPENDIX B 96 APPENDIX C 97 APPENDIX D 98 APPENDIX E 99 PUBLICATIONS 100 xi LIST OF FIGURES FIGURE NO TITLE 2.1 Nuclear Chain Reaction 8 2.2 Gamma Spectra from a Sample of Pottery 11 3.1 A reactor neutron spectrum is contributions from PAGE 25 a purely Maxwellian shape in the thermal energy region, an epithermal region and negligible fast spectrum 3.2 The spectrum observed by detector contribute by 29 interaction of gamma ray with germanium. 3.3 An example of ideal efficiency curve plotted 31 against gamma energy 4.1 TRIGA Puspati Reactor (RTP) with power of 1 33 Megawatt 4.2 Reactor rotary racks with experimental 34 irradiation facility 4.3 HPGe detector operated at liquid nitrogen 35 temperature 4.4 Set up of gamma ray spectrometer 36 xii 4.5 Canberra GC3018 detector with Genie 2000 37 Software 4.6 Ortec GEM-10185 detector with Gamma 37 Vision software 4.7 2 set of monitors irradiated with bare condition 39 and cadmium cover respectively 4.8 IAEA lake sediment sample sealed in a labeled 41 plastic and irradiated with standard polyethylene vial 5.1 Full energy peak detection efficiency curve for 48 Ortec detector at three sample-detector distances 5.2 Full energy peak detection efficiency curve for 53 Canberra detector at three sample- detector distances 5.3 Parameter á measurement at position 10 of 56 rotary rack TRIGA reactor 5.4 Parameter á measurement at position 22 of 58 rotary rack TRIGA reactor 5.5 Parameter á measurement at position 27 of 59 rotary rack TRIGA reactor 5.6 Parameter á measurement at position 31 of 61 rotary rack TRIGA reactor 5.7 IAEA Soil-1 elements at irradiation position of 81 10 in rotary rack 5.8 IAEA Soil-7 elements at irradiation position of 82 xiii 10 in rotary rack 5.9 IAEA Soil-1 elements at irradiation position of 83 22 in rotary rack 5.10 IAEA Soil-7 elements at irradiation position of 84 22 in rotary rack 5.11 IAEA Soil-1 elements at irradiation position of 85 27 in rotary rack 5.12 IAEA Soil-7 elements at irradiation position of 86 27 in rotary rack 5.13 IAEA Soil-1 elements at irradiation position of 87 31 in rotary rack 5.14 IAEA Soil-7 elements at irradiation position of 31 in rotary rack 88 xiv LIST OF TABLES TABLE NO. TITLE PAGE 3.1 Three main neutron groups 25 3.2 The nuclear data of gold used in calculating 28 thermal and epithermal neutron fluxes 4.1 Monitors and relevant nuclear data require 40 in the work. 5.1 Activity and Information on Radioactive 43 Gamma Sources 5.2 Standard gamma sources efficiency at the 44 distance of 10 cm from Ortec detector 5.3 Standard gamma sources efficiency at the of 6 cm 45 from Ortec detector 5.4 Standard gamma sources efficiency at the 46 distance of 2 cm from Ortec detector 5.5 Parameters P1 to P5 determined at the distance of 47 10 cm from Ortec detector 5.6 Parameters P1 to P5 determined at the distance of 6 cm from Ortec detector 47 xv 5.7 Parameters P1 to P5 determined at the distance of 47 2 cm from Ortec detector 5.8 Standard gamma sources efficiency at the 49 distance of 12 cm from Canberra detector 5.9 Standard gamma sources efficiency at the 50 distance of 8 cm from Canberra detector 5.10 Standard gamma sources efficiency at the 51 distance of 2 cm from Canberra detector 5.11 Parameters P1 to P5 determined at the distance of 52 12 cm from Canberra detector 5.12 Parameters P1 to P5 determined at the distance of 52 8 cm from Canberra detector 5.13 Parameters P1 to P5 determined at the distance of 52 2 cm from Canberra detector 5.14 Specific activities for 5 monitors irradiated bare 55 and with cadmium cover at irradiation position 10 of the rotary rack 5.15 Result of á parameter at irradiation position 10 56 calculated by iterative linear regression method 5.16 Specific activities for 5 monitors irradiated bare 57 and with cadmium cover at irradiation position 22 of the rotary rack 5.17 Result of á parameter at irradiation position 22 57 calculated by iterative linear regression method 5.18 Specific activities for 5 monitors irradiated bare 58 xvi and with cadmium cover at irradiation position 27 of the rotary rack 5.19 Result of á parameter at irradiation position 27 59 calculated by iterative linear regression method 5.20 Specific activities for 5 monitors irradiated bare 60 and with cadmium cover at irradiation position 31 of the rotary rack 5.21 Result of á parameter at irradiation position 31 60 calculated by iterative linear regression method 5.22 The results of thermal to epithermal flux ratio of 63 corresponding irradiation positions 5.23 Activity of bare gold at irradiation positions 63 10, 22, 27, and 31 of rotary rack TRIGA reactor 5.24 Activity of gold irradiated with cadmium cover at 64 irradiation positions 10, 22, 27, and 31 of the rotary rack TRIGA reactor 5.25 The results of thermal and epithermal neutron of 64 flux corresponding irradiation position 5.26 HOGDAHL reaction rate for elements irradiated 66 at irradiation position 10 of rotary rack 5.27 HOGDAHL reaction rate for elements irradiated 67 at irradiation position 22 of rotary rack 5.28 HOGDAHL reaction rate for elements irradiated 68 at irradiation position 27 of rotary rack 5.29 HOGDAHL reaction rate for elements irradiated 69 xvii at irradiation position 31 of rotary rack 5.30 The criterion for Z-score 71 5.31 IAEA Soil-1 result at irradiation position 10 73 by absolute method 5.32 IAEA Soil-7 result at irradiation position 10 74 by absolute method 5.33 IAEA Soil-1 result at irradiation position 22 75 by absolute method 5.34 IAEA Soil-7 result at irradiation position 22 76 by absolute method 5.35 IAEA Soil-1 result at irradiation position 27 77 by absolute method 5.36 IAEA Soil-7 result at irradiation position 27 78 by absolute method 5.37 IAEA Soil-1 result at irradiation position 31 79 by absolute method 5.38 IAEA Soil-7 result at irradiation position 31 by absolute method 80 xviii LIST OF SYMBOLS - Epithermal shape parameter f - Thermal to epithermal flux ratio th - Thermal neutron flux epi - Epithermal neutron flux ti - Irradiation time td - Decay time tm - Counting time A0 - Activity of irradiated sample NA - Avogadro’s number è - Natural isotopic abundance M - Atomic weight R - HOGDAHL Reaction Rate S - Correction factors for saturation during irradiation D - Correction factors for decay between irradiation and ã counting C - Correction factors for decay during counting m - Mass of the target element Np - full energy peak net count ã - Gamma abundance åã(E) - Detector efficiency at gamma energy N - Number of interacting isotopes (E) - Cross-section in cm2 at neutron energy of E in eV ö (E) - Neutron flux per unit of energy interval xix óo - Thermal neutron capture cross section at 2200 ms-1 Io - Resonance integral for a 1/E spectrum Io(á) - Resonance integral valid for 1/E 1+á spectrum Ecd - Cadmium cut-off energy Qo(á) - á- corrected Qo Qo - Io/óo ratio of resonance integral to (n, ã ) cross section Er - Effective resonance energy Rcd - Ratio of the specific count rates of the samples irradiated without and with a cadmium cover Abare - Activity of bare monitor Acd - Activity of monitor covered with cadmium Fcd - Ratio of the activity of a monitor with a zero cadmium cover thickness Zá(Asp,n) - Specific count rate random error Zá(Asp,n)bare - Bare specific count rate random error Zá(Asp,n)cd - Cadmium specific count rate random error Zá(Fcd,n) - Systematic errors of Fcd Zá(Qo,n) - Systematic errors of Qo Zá(Er,n) - Systematic errors of Er Zá(Ecd,n) - Systematic errors of Ecd Sá,T - Overall uncertainty of parameter n - Number of neutron per volume v - Velocity of the neutron. Pi - The fitted parameters of the function E - Gamma energy of the ith photopeak in MeV t1/2 - Half Life Z - Z-score xx LIST OF ABBREVIATIONS NAA - Neutron Activation Analysis HPGe - High-purity germanium detector FNAA - Fast Neutron Activation Analysis PGNAA - Prompt Gamma Ray Neutron Activation Analysis NAA - Neutron Activation Analysis MNA - Malaysia Nuclear Agency CRM - Certified Reference Materials MNA - Malaysia Nuclear Agency xxi LIST OF APPENDICES APPENDIX NO. TITLE A Scheme of Neutron Activation Analysis absolute PAGE 95 method in determination the concentration of element B Cd ratio for multi monitor method with 5 96 monitors at irradiation position 10 of the TRIGA reactor rotary rack C Cd ratio for multi monitor method with 5 97 monitors at irradiation position 22 of the TRIGA reactor rotary rack D Cd ratio for multi monitor method with 5 98 monitors at irradiation position 27 of the TRIGA reactor rotary rack E Cd ratio for multi monitor method with 5 monitors at irradiation position 31 of the TRIGA reactor rotary rack 99


