2011-2012 Harper Alternative School Multi Level
advertisement
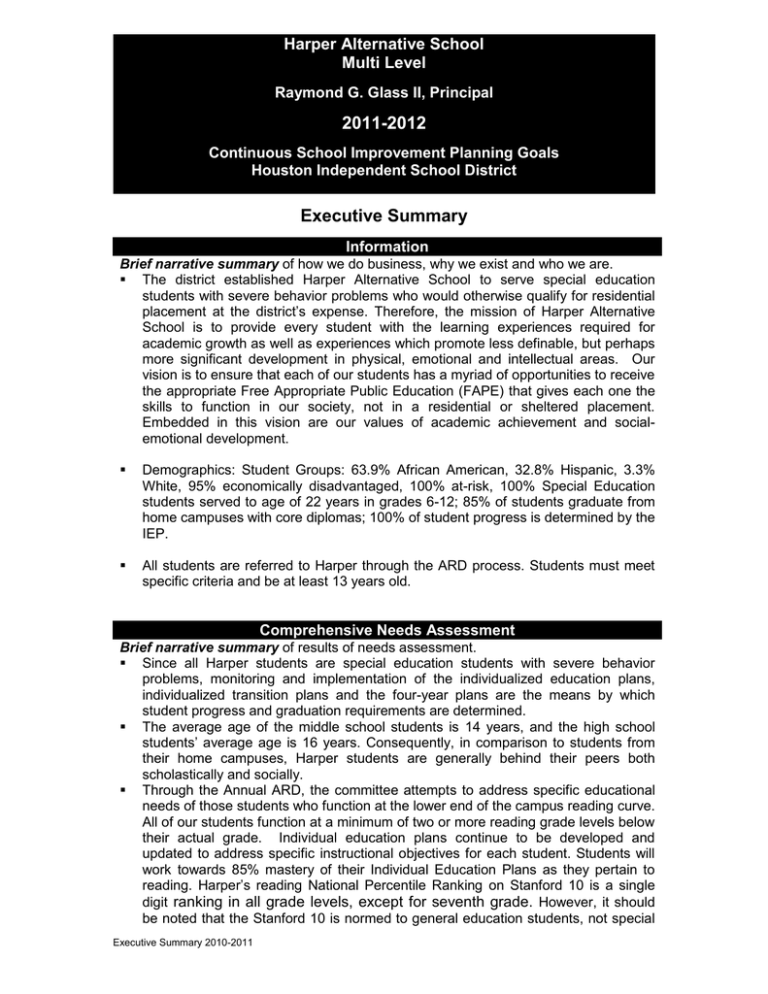
Harper Alternative School Multi Level Raymond G. Glass II, Principal 2011-2012 Continuous School Improvement Planning Goals Houston Independent School District Executive Summary Information Brief narrative summary of how we do business, why we exist and who we are. The district established Harper Alternative School to serve special education students with severe behavior problems who would otherwise qualify for residential placement at the district’s expense. Therefore, the mission of Harper Alternative School is to provide every student with the learning experiences required for academic growth as well as experiences which promote less definable, but perhaps more significant development in physical, emotional and intellectual areas. Our vision is to ensure that each of our students has a myriad of opportunities to receive the appropriate Free Appropriate Public Education (FAPE) that gives each one the skills to function in our society, not in a residential or sheltered placement. Embedded in this vision are our values of academic achievement and socialemotional development. Demographics: Student Groups: 63.9% African American, 32.8% Hispanic, 3.3% White, 95% economically disadvantaged, 100% at-risk, 100% Special Education students served to age of 22 years in grades 6-12; 85% of students graduate from home campuses with core diplomas; 100% of student progress is determined by the IEP. All students are referred to Harper through the ARD process. Students must meet specific criteria and be at least 13 years old. Comprehensive Needs Assessment Brief narrative summary of results of needs assessment. Since all Harper students are special education students with severe behavior problems, monitoring and implementation of the individualized education plans, individualized transition plans and the four-year plans are the means by which student progress and graduation requirements are determined. The average age of the middle school students is 14 years, and the high school students’ average age is 16 years. Consequently, in comparison to students from their home campuses, Harper students are generally behind their peers both scholastically and socially. Through the Annual ARD, the committee attempts to address specific educational needs of those students who function at the lower end of the campus reading curve. All of our students function at a minimum of two or more reading grade levels below their actual grade. Individual education plans continue to be developed and updated to address specific instructional objectives for each student. Students will work towards 85% mastery of their Individual Education Plans as they pertain to reading. Harper’s reading National Percentile Ranking on Stanford 10 is a single digit ranking in all grade levels, except for seventh grade. However, it should be noted that the Stanford 10 is normed to general education students, not special Executive Summary 2010-2011 education students. Consequently, our goal is to increase the reading NPR percentages to show growth from the prior year for those students tested at the same time and in attendance for a minimum of one semester. Harper students are assessed using TAKS-M and STAAR- Modified. This version of TAKS/ STAAR is an alternate assessment based on modified academic achievement standards designed for students who meet participation requirements and who are receiving special education services. TAKS–M/ STAAR-Modified has been designed to meet federal requirements mandated under the No Child Left Behind Act. TAKS–M/ STAAR- tests have been changed in format and test design to meet the needs of special education students. TAKS 2010-2011 th 6 grade: 5 students 1 out of 5 students met standards in math. 2 out of 5 students met standards in reading. 7th grade: 10 students 0 out of 10 students did not meet standards in math. 5 out of 10 students met standards in reading. 5 out of 10 students met standards in writing. 8th grade: 21 students 4 out of 21 students met standards in math. 5 out of 21 students met standards in reading. 8 out of 21 students met standards in science. 6 out of 21 students met standards in social studies. 9th grade: 19 students 2 out of 19 students met standards in math. 4 out of 19 students met standards in reading. 10th grade: 17 students 7 out of 17 students met standards in math. 3 out of 17 students met standards in reading. 6 out of 17 students met standards in science. 9 out of 17 students met standards in social studies. 11th grade: 10 students 2 out of 10 students met standards in math. 1 out of 10 students met standards in reading. 2 out of 10 students met standards in science. 3 out of 10 students met standards in social studies. Total= 82 Students Enrolled Total = 6 Did Not Take Test All classrooms will be assigned NCLB certified teacher assistants to augment the individual level of instruction in each classroom. Counselors have been reassigned by grade level to provide for more continuity to students and to better meet the individual academic and behavioral needs of all students. The changes to the academic structure at Harper have been met with high praise from its stakeholders and with a renewed sense of commitment and energy. Documentation of needs assessment such as charts and graphs should be placed in the Executive Summary 2010-2011 Addendum. Inquiry Process and Analysis Brief narrative summary of where we are now and where we want to be. Summary of root cause – effect analysis of academic strengths The academic strengths of our students are in career and technology education. Harper students continually excel in vocational courses, specifically culinary arts courses, agriculture courses, building construction courses, and small engine (auto repair) courses. Students consistently win contests in these CTE courses. The average passing grade in these courses for students is 85%. Each of these courses requires math and reading skills similar to academic courses, but what allows students to excel in them is that they are hands-on courses which do not generally demand abstract thinking. Summary of root cause – effect analysis of areas for Improvement A careful analysis reveals that areas for improvement include developing academic initiatives that build on the concrete activities of CTE courses while attempting to move student thinking skills from the concrete to the abstract. This is a huge challenge when working with special education students. In fact, a review of recent research reveals that there are few existing programs and even fewer successful programs. Those that show promise have yet to show long-term gains. SMART Goals based on root cause – effect analysis The 2011–2012 goals are to improve student academic functioning by 5% as measured by Math TAKS-M scores. In addition, Harper will incorporate strategies for academic performance on STAAR Modified EOC exam. Our previous year scores in Math were 6th grade: 5 students: 1 out of 5 students met standards in Math. 7th grade: 10 students: 0 out of 10 students did not meet standards in Math. 8th grade: 21 students: 4 out of 21 students met standards in Math. 9th grade: 19 students: 2 out of 19 students met standards in Math. 10th grade: 17 students 7 out of 17 students met standards in Math. 11th grade: 10 students 2 out of 10 students met standards in Math. The 2011–2012 goals are to improve student academic functioning by 5% as measured by Reading/ELA TAKS-M scores. In addition, Harper will incorporate strategies for academic performance on STAAR Modified EOC exam. Our previous year scores in Reading/ELA were 6th grade: 5 students 2 out of 5 students met standards in Reading. 7th grade: 10 students 5 out of 10 students met standards in Reading. 5 out of 10 students met standards in Writing. 8th grade: 21 students 5 out of 21 students met standards in Reading. 9th grade: 19 students 4 out of 19 students met standards in Reading. 10th grade: 17 students 3 out of 17 students met standards in Reading. 11th grade: 10 students 1 out of 10 students met standards in Reading. Total= 82 Students Enrolled Total = 6 Did Not Take Test Increase attendance rate for campus by 5%. Attendance Rate for 10-11 was 75.2%, will increase to 80% for 2011-2012. Documentation of inquiry process and detailed analysis should be placed in the Addendum. Quality Design and Planning Brief narrative summary of our gaps and how we will get to where we want to be. Our most significant gap is the severe emotional problems which have impeded the academic achievement of our students going back to their earliest years in school. This academic gap is closely correlated to the social malfunctioning of the students. Coupled with this is the history of failure students be referred to Harper; it is almost an expectation on their part that they will never be successful in the academic classroom. Executive Summary 2010-2011 Thus, our programs seek to build on those areas where students have shown both achievement and interest—CTE courses. We are continuing to research programs that show promise in working with the severely emotionally disturbed. We are also attempting to align instructional strategies between CTE and academic courses. Programs supporting SMART goals – PLC meetings focused on alignment of strategies; teachers collaborate to plan incentive programs for behavior, attendance, achievement, monitor, adjust and evaluation of strategies. Processes for intervention—counseling focused on expressed and implied student needs both in individual and group sessions; crisis management for individual students; anger management for individual students; pre and post-testing on discrete objectives; parent sessions and training. Professional Development— Academic area in-services by district, Region IV, and Department Chairpersons. Partnerships – engaged stakeholders, Uncle Buddy’s Auto Sales, and Damascus Baptist Church. Documentation of design and planning are detailed in the SIP template with strategy/action steps, person responsible, formative/summative assessments, resources, and timelines. Continuous Improvement Monitoring and Evaluation Brief narrative summary of how we will monitor and evaluate our efforts throughout the school year. Each teacher and staff member has responsibility for contributing to the success of our students. Each individual will have specific responsibilities assigned and will be asked to report to the larger group and/or administration. On-going assessment process and feedback: Augment student performance by a specific review of curriculum impact, time for students and the effect of teaching practices on achievement. Review and analyze data of student performance in multiple content and context areas Monitoring systems – acts of leadership: Nurture a collaborative culture in implementation of initiatives and strategies; communicate and disseminate to all primary stakeholders a transparent plan that describes process and results; monitor and assess at regular intervals. Documentation of on-going assessments and monitoring systems are detailed in the SIP template with strategy/action steps, person responsible, formative/summative assessments, resources, and timelines. Executive Summary 2010-2011
