vii ii iii iv
advertisement
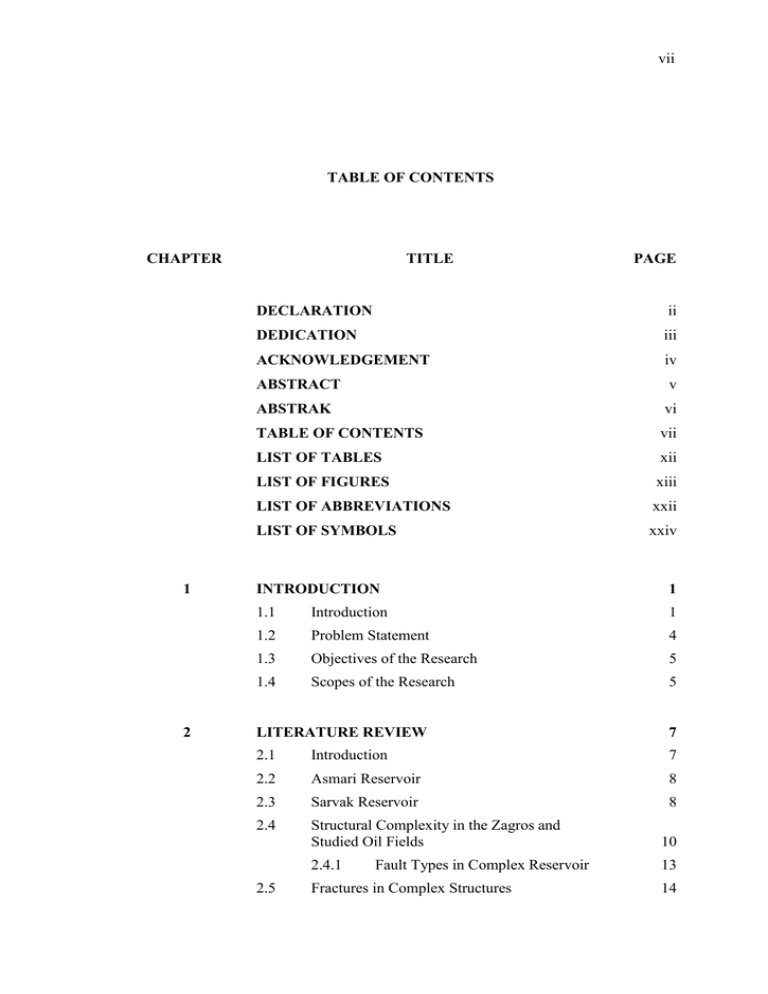
vii TABLE OF CONTENTS CHAPTER 1 2 TITLE PAGE DECLARATION ii DEDICATION iii ACKNOWLEDGEMENT iv ABSTRACT v ABSTRAK vi TABLE OF CONTENTS vii LIST OF TABLES xii LIST OF FIGURES xiii LIST OF ABBREVIATIONS xxii LIST OF SYMBOLS xxiv INTRODUCTION 1 1.1 Introduction 1 1.2 Problem Statement 4 1.3 Objectives of the Research 5 1.4 Scopes of the Research 5 LITERATURE REVIEW 7 2.1 Introduction 7 2.2 Asmari Reservoir 8 2.3 Sarvak Reservoir 8 2.4 Structural Complexity in the Zagros and Studied Oil Fields 10 2.4.1 13 2.5 Fault Types in Complex Reservoir Fractures in Complex Structures 14 viii 2.6 Permeability in Fractured Carbonate Reservoir 16 2.7 Oil Based Mud System in Iran 18 2.8 Borehole Imaging Development and Application 19 Borehole Imaging Tools 23 2.9.1 Water Based Mud Imaging 23 2.9.2 Oil Based Mud Imaging 23 2.9 2.10 3 Summary 32 RESEARCH METHODOLOGY 36 3.1 Introduction 36 3.2 Data Collection 37 Geological data – FMI, OBMI-UBI and Cores 38 3.2.2 Petrophysical data – PEX, HRLA 40 3.2.3 Formation testing data – MDT and XPT 40 3.2.1 3.3 Data Quality 41 3.4 FMI Log Processing 43 3.4.1 3.5 Sticking Detection and Speed Correction 45 3.4.2 FMI Scaling 46 3.4.3 Static and Dynamic Normalization of FMI Image in BorNor 49 OBMI Log Processing 3.5.1 3.5.2 51 Sticking Detection and Speed Correction in BorEid 51 Static and Dynamic Normalization in BorNor 51 3.6 UBI Log Processing 52 3.7 FMI Log Interpretation 55 3.7.1 3.7.2 3.8 Dip Interpretation on Image Log in BorView as input to BorTex Module 59 BorTex 64 OBMI-UBI Log Interpretation 71 3.8.1 Bedding 71 3.8.2 Fractures 72 ix 4 3.9 BorTex Processing for deriving SRES 75 3.10 Summary 77 RESERVOIR CHARACTERIZATION BY USING FMI, MDT AND CORES 79 4.1 Introduction 79 4.2 An Accurate Structural Model by Introducing a Structural System in the Complex Fractured Reservoirs (LL-26) 81 4.2.1 Structural and Fracture Interpretation 81 Complex Fault System 84 Permeability Analysis in Asmari Reservoir (PZ-126) 90 4.2.2 4.3 4.3.1 4.3.2 90 Natural Fracture Characterization (Verification Data) 96 4.4 Permeability Result 102 4.5 Porosity Result and Integration of Porosity and Permeability Result from FMI 104 Verification of FMI Permeability with MDT Permeability 106 Verification of FMI Permeability with Core Permeability in PZ-126 109 Verification of FMI Permeability with Core Permeability in Non-Highly Fractured Reservoir 110 The Effect of Tar on the Permeability Analysis from FMI in Asmari Fractured Reservoir (RS-55) 115 Summary 117 4.6 4.7 4.8 4.9 4.10 5 Structural Dip as Input Data for Permeability Analysis in PZ-126 RESERVOIR CHARACTERIZATION BY USING OBMI, XPT AND CORES 119 5.1 Introduction 119 5.2 Structural Dip as Input Data for Mobility Analysis 121 5.2.1 Zone 1 124 5.2.2 Zone 11 126 x 5.3 5.2.3 Zone 20 127 5.2.4 Sub Zone 28 128 5.2.5 Zone 30 129 5.2.6 Sub Zone 36-30 129 5.2.7 Zone 40 131 5.2.8 Zone 40-80 132 5.2.9 Zone 50 134 Natural Fracture Characterization (Verification Data) 136 5.4 Quantitative Rxo in OBM in Marun Field 141 5.5 RFT/MDT Survey Planning 144 5.6 Reservoir Fluid Mobility 148 5.7 Index Permeability from OBMI in MN-322 149 5.7.1 5.7.2 5.8 5.9 5.10 5.11 6 Separations between HDRS, HMRS and OBMI-Rxo Curves 149 Index Mobility in Marun-322 156 Verification of OBMI Index Permeability with XPT Permeability 158 The Evaluation of OBMI-UBI Result Comparing with Cores in Sarvak Fractured Reservoir (GS-016) 161 5.9.1 OBMI-UBI Analysis 161 Comparison between OBMI-UBI and Core Image 168 5.10.1 169 Comparison of Results Summary 173 BOREHOLE CONDITION EVALUATION BY USING FMI AND UBI 175 6.1 Introduction 175 6.2 Detailed Borehole Shape Analysis 175 6.2.1 Borehole Restrictions 184 6.2.2 Optimization of Mud Weight 184 6.2.3 Efficient Use of Lost Circulation Material 186 Alteration to Well Trajectory 186 6.2.4 6.3 Time Lapse Imaging 187 xi 6.4 7 6.3.1 Borehole Stability 187 6.3.2 Fracture Characterization 188 6.3.3 Pressure and Fluid Sampling Points 189 6.3.4 Fluid Movement 189 Summary 191 CONCLUSIONS 192 7.1 Development of an Accurate Structural Model 192 7.2 Characterization of Fractured Reservoirs 193 7.3 Computation of Reliable Mobility Index 194 7.4 Evaluation of the Borehole Condition 195 REFERENCES 198 xii LIST OF TABLES TABLE NO. 2.1 TITLE PAGE Significant events in the development of borehole imaging tools. 22 2.2 UBI specification (Schlumberger, 2002). 28 2.3 Applications of borehole images acquired with Schlumberger borehole imaging tools. 35 2.4 New applications of borehole images in the research study. 35 4.1 Summary of the characterization of fracture zones, mainly based on the mean porosity of the interval. 101 Zones of raw permeability index and secondary porosity. 107 4.2 xiii LIST OF FIGURES FIGURE NO. TITLE PAGE 1.1 Studied oilfields (red colored) in Dezful embayment. 2 1.2 Asmari and Sarvak reservoirs in Iran (Bosold et al., 2005). 3 2.1 Asmari and Sarvak reservoirs in Iran (Schlumberger, 2005). 9 2.2 Geological and structural units of Iran (Richards et al., 2006). 11 2.3 Tectonics map showing location of Iran between the Eurasian and Arabian tectonic. Foreland folding in the south west of Zagros convergence and large-scale strike-slip faults are indicated in Iran (Motiei, 1995). 12 NW-SE trending major anticline structures in the Foreland basin of the Zagros Mountains (Motiei, 1995). 12 Normal, reverse and strike-slip faults (Costain and Coruh, 1989). 14 Increased borehole coverage over time. As more image data are acquired from around the circumference of the borehole, a more comprehensive interpretation is possible. Schlumberger micro resistivity-imaging devices have progressively added more sensors and pads to improve borehole coverage (Cheung and Laronga, 2001). 25 Schematic showing (a) side and (b) front views of a pad of OBMI. The tool has four pads; each pad carries five sets of sensors, which measure the voltage drop DV in the formation facing the sensors. To get more borehole coverage, more than two passes can be made that can be displayed together in one track (Cheung and Laronga, 2001). 25 Schematic showing (a) side and (b) front views of a pad of OBMI. An AC current is injected between the current electrodes A and B via the formation. Two voltage button sensors (C and D) measure the voltage drop V in the formation facing the sensors (Cheung and Laronga, 2001). 26 2.9 OBMI specification (Cheung and Laronga, 2001). 26 2.10 UBI tool Configuration and right, UBI transducers for different hole sizes (Cheung and Laronga, 2001). 27 2.4 2.5 2.6 2.7 2.8 xiv 2.11 Optimization of mud weight (Jeffreys, 2005). 30 2.12 Example of breakouts and drilling-induced fractures (DIFs) observed on acoustic image logs. 32 3.1 Specific research activity workflow. 37 3.2 Logging tools used to gather geological data. 39 3.3 Cross-plot between Ax & Ay, axes of accelerometers and FX & FY of magnetometers indicate that the directional information from GPIT is correct. 44 3.4 Flow chart of FMI and OBMI-UBI image processing chain. 45 3.5 Oriented enhanced image (right: before speed correction and left: after speed correction) (Schlumberger, 1999). 47 3.6 Static versus resistivity matched (Schlumberger, 1999). 48 3.7 Left: static image (Equalized) computed over the entire file, and right: Dynamic image (Enhanced) computed over 20 cm sliding window. 50 3.8 OBMI Static and Dynamic image in Marun-297. 52 3.9 Geoframe snapshot showing ultra-sonic image attributes editor panel. 54 Geoframe snapshot showing cross section plot (left) and spiral plot (right). 54 3.11 UBI Static and Dynamic image in Marun-297. 55 3.12 Basic of dip computation (Schlumberger, 1999). 57 3.13 Left, manual picking of points for dip computation, and right, calculated dip plane. 58 3.14 Different dips planes (Schlumberger, 1999). 58 3.15 FMI image showing layering within the Asmari formation. The dips corresponding to layer / bed boundaries are shown as high and low confidence based on their sharpness and planarity for computation of structural dip. Dips of high confidence bedding (circle green tadpoles) and low confidence bedding (triangular green tadpole) are presented in Asmari formation. 61 Example of open fractures and open vuggy fracture in Asmari formation seen by the FMI. The most of the open fractures are not continuous. 62 3.17 Example of closed fractures (resistive fractures). 63 3.18 Background conductivity and layer computation. 65 3.19 A snapshot from BorTex (software used to extract heterogeneities and layer details from images) highlighting the type of information output by itself. Displayed in the is a formation average background and layer conductivities in Track-3 and True-Stratigraphic-Thickness in Track-4. 66 3.10 3.16 xv 3.20 A principle used in BorTex to identify spots and patches. 68 3.21 BorTex heterogeneity analysis of a FMI image. Note the fit between the vuggy zones in the carbonate of the core and the conductive anomalies (red spots) in the BorTex display. 69 FMI calibrated images highlighting resistive features comprising a section of Asmari Formation. Contoured / outlined in blue are resistive / dense features (patches in cyan and spots in blue (the spots are those dense / resistive features / areas whose dimensions are less than 0.003 m2)). 70 FMI calibrated images highlighting conductive features comprising a section of Asmari formation. Contoured/outlined in red are conductive-connected spots (i.e., the features smaller than 0.0003 m2), in dark brown are isolated conductive spots, and in dark magenta are conductive patches (i.e. conductive features, larger than 0.003 m2). 70 3.24 Formula for normalization of FMI permeability. 71 3.25 OBMI-UBI image showing layering within Asmari formation. The dips corresponding to layer/bed boundaries are shown as high and low confidence based on their sharpness and planarity for computation of structural dip. 72 Continuous (blue circular dips) and discontinuous (blue triangular dips), possible (blue minus dips) open fractures by OBMI-UBI image in Asmari formation. 73 Closed (cyan circular dips) fractures shown by OBMI images in Asmari formation. 74 3.28 Lamination density in Asmari reservoir in Marun-322. 76 4.1 The location map of the well#LL-26 in the Lali Field. 80 4.2 The location map of the well#PZ-126 in the Pazanan field. 80 4.3 Layering in Asmari formation and statistical plots of bedding dips indicating an average dip of 24 degrees S38W and strike N52W-S52E. Average dip inclination of 24 degrees is the most representative of the whole interval of Asmari formation. 82 Open fractures (blue circle) in Asmari are striking as oblique to the bedding strike. 83 Open fractures in Asmari striking as oblique to the bedding strike, Schmidt projection plot (upper hemisphere) of fracture dip poles. The dip inclination histogram shows large spread for a dip while dip azimuth rosette shows that the most of the fracture dips to the southwest with a large scatter. 84 Composite plot of orthogonal calipers (C1 and C2), GR, FMI static normalized images, dips, well deviation, FMI fractures, RHOZ, NPHI, PEFZ and resistivity curves in Asmari formation. Major fault is in zone 5 with dipping to the NNW at 59 degrees. 87 3.22 3.23 3.26 3.27 4.4 4.5 4.6 xvi 4.7 4.8 4.9 4.10 4.11 4.12 4.13 4.14 4.15 4.16 4.17 4.18 4.19 Composite plot of orthogonal calipers (C1 and C2), GR, FMI static normalized images, dips, well deviation, FMI fractures, RHOZ, NPHI, PEFZ and resistivity curves in Asmari formation. The combination of FMI and open hole logs (resistivity) shows major fault 1819m in zone 5 of Kalhur member. 88 Schematic computer generated model using the reverse-fault model (major fault in zone 5). 89 Composite plot of orthogonal calipers (C1 and C2), GR, FMI static normalized images, dips, well deviation in Asmari formation. Schematic computer generated model using the reverse-fault model. Drag zone and disturbed zone associated with the fault are shown. See over-turning of beds in the fault influenced zone. Structural dips of the sections above and below the faulted region are also marked. 89 The new sidetrack (red) is drilled based on the studied structural model in the sidetrack 1 (blue). 90 High confidence (circle green tadpoles) is presented in Gachsaran formation. 91 Statistical plots of bedding dips indicating an average dip of 26 degrees S36W and strike N54W-S54E. An average dip inclination of 26 degrees is the the most representative of the whole interval of Asmari formation. 92 Computer based structural cross-section using bedding dip data projected along SSW-NNE plane. A structural dip of 26 degrees S36W the most representative of the whole interval of Asmari formation. 93 Composite plot of orthogonal calipers (C1 and C2), HCGR, FMI static normalized images, dips, well deviation, open fracture density, aperture, porosity, resistivity curves, RHOZ, 95 Minor open fractures (blue triangle dips), Medium open fractures (blue circular dips) and Major open fractures (blue square dips) shown by FMI image in Zone 6.1 of Asmari formation. 98 Statistical plots for dips of all open fractures in the Asmari formation. 99 Statistical attribute dips of all fractures and bedding dip attribute showing commonly oblique fractures in the Asmari interval. 100 FMI calibrated images showing yellow lines (forming cluster of yellow lines) connecting the conductive spots (red contoured features) in a section of Asmari Formation. 103 Porosity histogram display over a section of Asmari (Sub Zone 2-1). In this zone, FMI has detected a higher porosity xvii streak and porous patches, which Log porosity is not responding and remains constant. 105 Composite plot of orthogonal calipers (C1 and C2), HCGR, FMI static normalized images, open fracture density, aperture, porosity, resistivity curves, PHIT, NPHI curves, MDT pressure, MDT mobility points, lithology, FMI image, porosity and FMI raw permeability indicator across the Asmari formation. 108 4.21 Good match between FMI and core permeability. 109 4.22 Porosity waveform histogram/secondary and total porosity from FMS, 3680-3682m. This interval is near the boundary of the layers 5 & 6. The rock texture is changed and porous/permeable sections are indicated by the image and Prospect*. The core sample photo is clearly showing a big vugs, which is also seen on the image. 111 Porosity waveform histogram/secondary and total porosity from FMS, 3682-3684m. This interval is one of the most productive intervals in the borehole. The slabbed core photo is clearly indicated vuggy section, which is distinctive on the image and from the results. 112 4.24 Permeability analysis results, Layer-6. 114 4.25 Composite plot of orthogonal calipers (C1 and C2), GR, FMI static normalized images, open fracture density , aperture, porosity, resistivity curves, PHI, TNPH curves, lithology, FMI image, FMI porosity and FMI raw permeability indicator across Asmari formation. 116 5.1 Location map of the well#MN-322 in the Marun field. 120 5.2 A section of Gachsaran contour map showing location of well GS-16. 120 5.3 Header details for 5.4. 122 5.4 High and low confidence OBMI and UBI bedding in Asmari formation. 123 5.5 Marun reservoir zonations (N.I.S.O.C et al., 2003) 124 5.6 Lithology and statistical plots for dips of Zone 1 bed boundaries. 125 5.7 Lithology and statistical plots for dips of zone 11. 126 5.8 Lithology and statistical plots for dips of Zone 20 bed boundaries. 127 Lithology and statistical plots for dips of sub Zone 28 bed boundaries. 128 Lithology and statistical plots for dips of Zone 30 bed boundaries. 130 4.20 4.23 5.9 5.10 xviii 5.11 Lithology and statistical plots for dips of Zone 36-30 bed boundaries. 131 Lithology and statistical plots for dips of Zone 40 bed boundaries. 132 Lithology and statistical plots for dips of Zone 40-80 bed boundaries. 133 Lithology and statistical plots for dips of Zone 50 bed boundaries. 134 Statistical plots of bedding dips indicating an average dip of 35 degrees N32E and strike N58W-S58E. Average dip inclination of 35 degrees is the most representative of the whole interval of Asmari formation. 135 Computer based structural cross-section using bedding dip data projected along SSW-NNE plane. A structural dip of 37 degrees S45W is the most representative of the whole interval of Asmari formation. 136 Continuous (blue circular dips), discontinuous (blue triangular dips) open fractures shown by UBI and OBMI images in Asmari formation. 138 Statistical plots of dips of all open fractures in the Asmari interval. 139 Statistical plots of dip attributes of all closed fractures in the zones of Asmari formation. 139 Composite plot of GR, orthogonal calipers (C1 and C2), RHOB, NPHI and PE curves, resistivity curves, XPT pressure data on the OBMI image, OBMI static normalized images, dips, OBMI-UBI open and closed fracture, well deviation, UBI static normalized images and lithology. 140 A section of the Marun contour map showing location of well MN-292. 141 OBMI Rxo showing large separation from induction resistivity logs in a section of Asmari sandstone sections of the MN-292 of Marun field. 142 OBMI Rxo display separation from induction resistivity logs in carbonate. 143 5.24 Large separation between OBMI Rxo and induction resistivity logs in a section of Asmari sandstone sections of the MN-292 of Marun field. 143 5.12 5.13 5.14 5.15 5.16 5.17 5.18 5.19 5.20 5.21 5.22 5.23 5.25 OBMI Rxo showing large separation from induction resistivity logs in a section of Asmari sandstone sections of the well MN292 in Marun field indicating large invasion due to permeability. RFT mobility (blue circles) also computes higher mobility in the same sections. 145 xix 5.26 The location of dry test points (yellow circles) of RFT in a section of Asmari of well MN-292of Marun field, correspond to shale streaks or very low permeability streaks indicated by OBMI images. No invasion in such streaks is observed on Rxo and induction curves indicating their very low permeability. RFT formation mobility is indicated by blue circles. 145 A section of Marun contour map showing location of well MN-297 146 The locations of dry test points (yellow circles) of RFT in a section of Asmari, correspond to shale streaks or very low permeability streaks indicated by OBMI images. No invasion in such streaks is observed on Rxo and induction curves indicating their very low permeability. RFT formation mobility is indicated by blue circles. 147 Locations of dry test points (yellow circles) of RFT in a section of Asmari of well MN-297. RFT formation mobility is shown by blue circles. 149 The separation between OBMI Rxo and HDRS, HMRS (deep and shallow resistivity) shows high mobility zones comparing with XPT mobility (yellow circle) in the water zone. 150 The separation between OBMI Rxo and HDRS, HMRS (deep and shallow resistivity) shows high mobility zones comparing with XPT mobility (yellow circle) in the oil zone. 151 The separation between OBMI Rxo and HDRS, HMRS (deep and shallow resistivity) show oil based mud fluid invasion because of borehole damage 152 5.33 The separation between OBMI Rxo and HDRS, HMRS (deep and shallow resistivity) is an indication of no invasion comparing with XPT mobility (yellow circle). 153 5.27 5.28 5.29 5.30 5.31 5.32 5.34 OBMI Rxo shows borehole damage in zones of high formation resistivity. 154 Match between OBMI Rxo and HDRS, HMRS (deep and shallow resistivity) shows no invasion and impermeable formation oil saturated rock with very irreducible water. 155 Composite plot of GR, orthogonal calipers (C1 and C2), RHOB and NPHI curves, OBMI static normalized images, XPT pressure data, dips, well deviation, UBI static normalized images, lithology, and Index mobility from OBMI in the Asmari reservoir. 157 5.37 XPT mobility in different depth interval in Asmari reservoir. 158 5.38 Composite plot of GR, orthogonal calipers (C1 and C2), RHOB and NPHI curves, OBMI static normalized images, XPT pressure data, dips, well deviation, UBI static normalized images, lithology, index mobility from OBMI, index 5.35 5.36 xx permeability from OBMI and XPT (red circle) in the Asmari reservoir. 160 OBMI and UBI images showing layering due to argillaceous intercalations within upper Sarvak. The dips corresponding to layer/bed boundaries are shown as low and high confidence based on their sharpness and planarity for computation of structural dip. 163 Statistical plots of all bedding dips indicating a dominant structural dip of 71 degrees S38W and strike N52W-S52E. 164 Computer based structural cross-section using bedding dip data projected along a NNE-SSW plane. 165 A highly fractured section in the middle part of the reservoir, showing continuous and discontinuous open fractures. 167 The summary of fracture analysis results in GS-16. Apart from some short sections open fractures are present in its most intervals. 170 Clear bedding planes dipping 50-60 degree SW along with minor open fractures (partially cemented). 171 Interval where UBI images affected by borehole breakout whereas OBMI images clearly indicate the bedding planes and minor fractures (probably cemented). 171 Major open fracture cross- cutting bedding plane possible slickenside on core along the fracture plane. 172 The clear example of both major and minor fracture types on OBM log images coinciding with broken core. 172 5.48 Image log shows intensive fracturing hence the core rubble. 173 6.1 Fracture patterns examples of UBI cross-section plots in Iran. 177 6.2 Borehole breakouts and hydraulic fractures indicate that orientation of the maximum horizontal stress is changing across the studied field. 179 In-Situ stress analysis provided in different wells in the Marun field (Movahed et al., 2014). 180 In-Situ stress analysis provided in different wells in Gachsaran field (Movahed et al., 2014). 180 6.5 Image logs quality control flag color. 182 6.6 UBI image of the borehole radius showing borehole enlargements (breakouts – black vertical stripes) around NW and SE sides of the borehole. 185 Asymmetrical borehole wall damage resulting from mechanical wearing related to reaming and pipe rotation. 187 5.39 5.40 5.41 5.42 5.43 5.44 5.45 5.46 5.47 6.3 6.4 6.7 xxi 6.8 FMI Images acquired over a period of 7 days, the increase in aperture of drilling fractures and the development and/or enlargement of borehole breakouts (left to right). 190 xxii LIST OF ABBREVIATION BS - Bit Size C1 - Caliper Pair 1-3 C2 - Caliper Pair 2-4 CGR - Gamma Ray (Corrected) CKH - Core Horizontal Permeability COND.CONNECTED.SP - Conductive Connected Spots COND.PATCHES Conductive Patches - COND.ISOLATED.SPOT - Conductive Isolated Spots CPOR - Core Porosity CS - Cable Speed DEVI - Borehole Deviation Angle (deg) DYNAMIC - Sliding Window Normalization EMEX - Measurement Control Voltage FMI - Full bore Formation Micro Imager Tool FRACTURE APERTURE - Aperture of Fractures FARCTURE DENSITY - Number of Fractures Per Meter FRACTURE POROSITY - Porosity of Fractures GEOLOG - Geological Lithozones GPIT - General Purpose Inclinometry Tool HAZI - Borehole Deviation Azimuth (deg) HC BEDDING - High Confidence Bedding HDRS - Deep Resistivity HGR - Gamma Ray HMRS - Shallow Resistivity ILD - Deep Resistivity (Deep Induction) ILM - Shallow Resistivity (Shallow Induction) LQC - Log Quality Control xxiii LC BEDDING - Low Confidence Bedding MDT - Modular Formation Dynamics Tester Tool NPHI - Neutron Porosity OBMI - Oil Base Mud Imager P1AZI - Pad 1 Azimuth (deg) PE - Photoelectric Factor PEFZ - Photoelectric Factor PERM - Permeability from FMS PERM.INDEX - Raw FMI Permeability Indicator (Mobility) PEX - Platform Express PHIS - Secondary Porosity PHIT_FMI - Average High-resolution Porosity from FMI PIGE - Shale Corrected Log Porosity POR_HIST - Porosity Histogram PP - Pad Pressure RES.SOPTS - Resistive Spots PES.PATCHES - Resistive Patches RHOZ - Formation Density RLA3 - Shallow Resistivity RLA5 - Deep Resistivity SPOR - Secondary Porosity from FMI STATIC - Fixed Window Normalization TENS - Tension TNPH - Porosity from Neutron Log UBI - Ultrasonic Borehole Imager tool WALL - Borehole Wall XPT - Xpress Pressure Tool xxiv LIST OF SYMBOLS Symbol Dip Classification - High Confidence Bedding - Low Confidence Bedding - High Confidence OBMI Bedding - Low Confidence OBMI Bedding - High Confidence UBI Bedding - Low Confidence UBI Bedding - Minor Open fractures - Major open fractures - Medium open fractures - Closed fracture - Continuous open fractures - Discontinuous open fractures - Fault
