Data normalization
advertisement
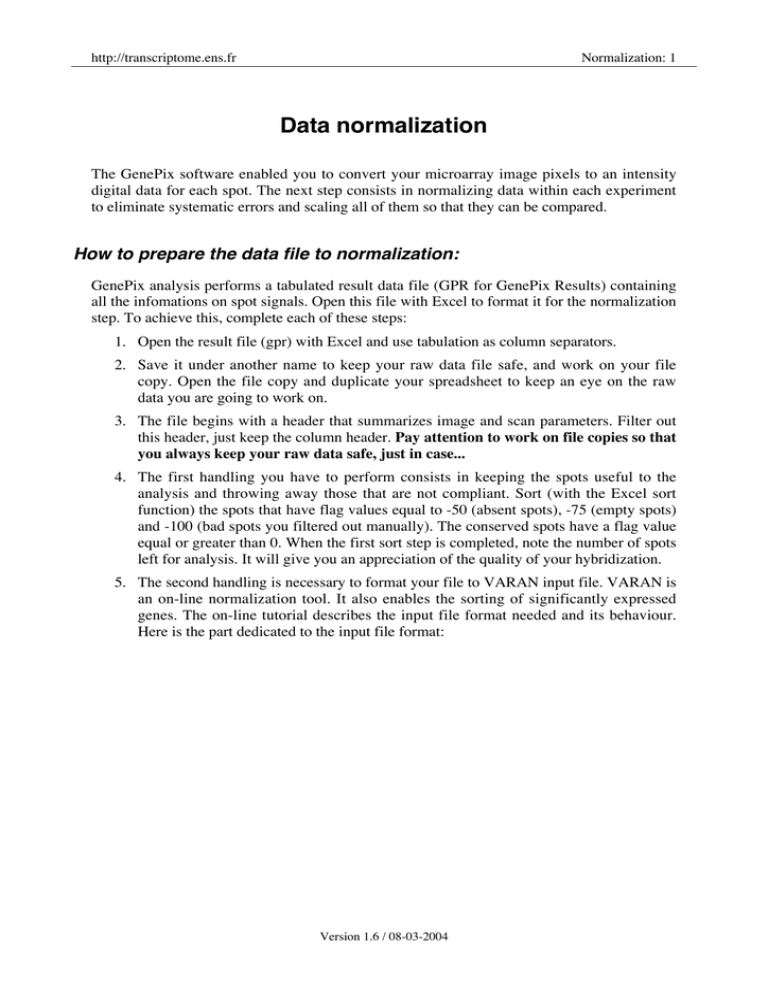
http://transcriptome.ens.fr Normalization: 1 Data normalization The GenePix software enabled you to convert your microarray image pixels to an intensity digital data for each spot. The next step consists in normalizing data within each experiment to eliminate systematic errors and scaling all of them so that they can be compared. How to prepare the data file to normalization: GenePix analysis performs a tabulated result data file (GPR for GenePix Results) containing all the infomations on spot signals. Open this file with Excel to format it for the normalization step. To achieve this, complete each of these steps: 1. Open the result file (gpr) with Excel and use tabulation as column separators. 2. Save it under another name to keep your raw data file safe, and work on your file copy. Open the file copy and duplicate your spreadsheet to keep an eye on the raw data you are going to work on. 3. The file begins with a header that summarizes image and scan parameters. Filter out this header, just keep the column header. Pay attention to work on file copies so that you always keep your raw data safe, just in case... 4. The first handling you have to perform consists in keeping the spots useful to the analysis and throwing away those that are not compliant. Sort (with the Excel sort function) the spots that have flag values equal to -50 (absent spots), -75 (empty spots) and -100 (bad spots you filtered out manually). The conserved spots have a flag value equal or greater than 0. When the first sort step is completed, note the number of spots left for analysis. It will give you an appreciation of the quality of your hybridization. 5. The second handling is necessary to format your file to VARAN input file. VARAN is an on-line normalization tool. It also enables the sorting of significantly expressed genes. The on-line tutorial describes the input file format needed and its behaviour. Here is the part dedicated to the input file format: Version 1.6 / 08-03-2004 http://transcriptome.ens.fr Normalization: 2 6. You have to choose whether you use the mean or the median of the intensities to estimate the spot general intensity. The median is currently used and advised because of its capacity to smooth the pixel differences that appear if the hybridization is too heterogeneous. Keep the columns that correspond to the gene name, the identifier, the Cy3 signal (F532 median), the Cy3 background (B532 median), the Cy5 signal (F635 median), the Cy5 background (B635 median) and the block identifier. This identifier is use to keep the spatial information when you perform a Loess normalization. Remember Cy3 is the green dye and Cy5 the red one. 7. VARAN accepts only one annotation column. As we want to keep the gene name and its unique identifier, a useful way to discriminate replicated spots on your slide (Remember the S. cerevisiae slides are double genome microarrays, each spot has a replicate), we have to concatenate the Name and ID columns. To achieve this, insert two new columns between the ID and F532 columns. In one of these, apply the concatenate function (you currently find Excel functions in the “Insertion menu”) to the Name and ID separated by a semicolon “;”. Version 1.6 / 08-03-2004 http://transcriptome.ens.fr Normalization: 3 8. Once you have achieved the concatenation, you have to copy the values of the whole column and paste it with the special paste in the empty column left. This enables you to paste the values in the columns and not the function. You can now suppress the ID and Name columns. Version 1.6 / 08-03-2004 http://transcriptome.ens.fr Normalization: 4 9. The last sorting step consists in deleting all the saturated spots from the file. the saturated spot in one channel will not have a meaningful ratio. It makes no sense to keep them. Sort the spot by decreasing Cy3 intensities, then delete all the lines where intensity values are bigger than a fixed threshold (for example, you can choose 55000). Repeat this for the Cy5 intensities. You have now suppressed all the saturated spots. 10. Delete the header line and save your file as a text file (tabulations as separator). You are now ready to import your file in VARAN. VARAN use: 1. Once you have reached the VARAN index page, click on the “VARAN Generator” link to get the script we will use. 2. The different tool options are described in the on-line help. Here are the main options we will use: as we want to apply the Loess normalization to our data, we need to fix a window overlap percentage to calculate the regression curves. 3. Launch VARAN and note your query identifier in case you need to access it later on. 4. The VARAN result page enables you to visualize your experiment MA-plot and contains a link to your normalised data file. You may also have a significatively expressed gene list if ever VARAN completed the asymptote design. Report yourself to the on-line help for further details on the results files. Version 1.6 / 08-03-2004 http://transcriptome.ens.fr Normalization: 5 Version 1.6 / 08-03-2004

