b. 1. 2. 3.
advertisement

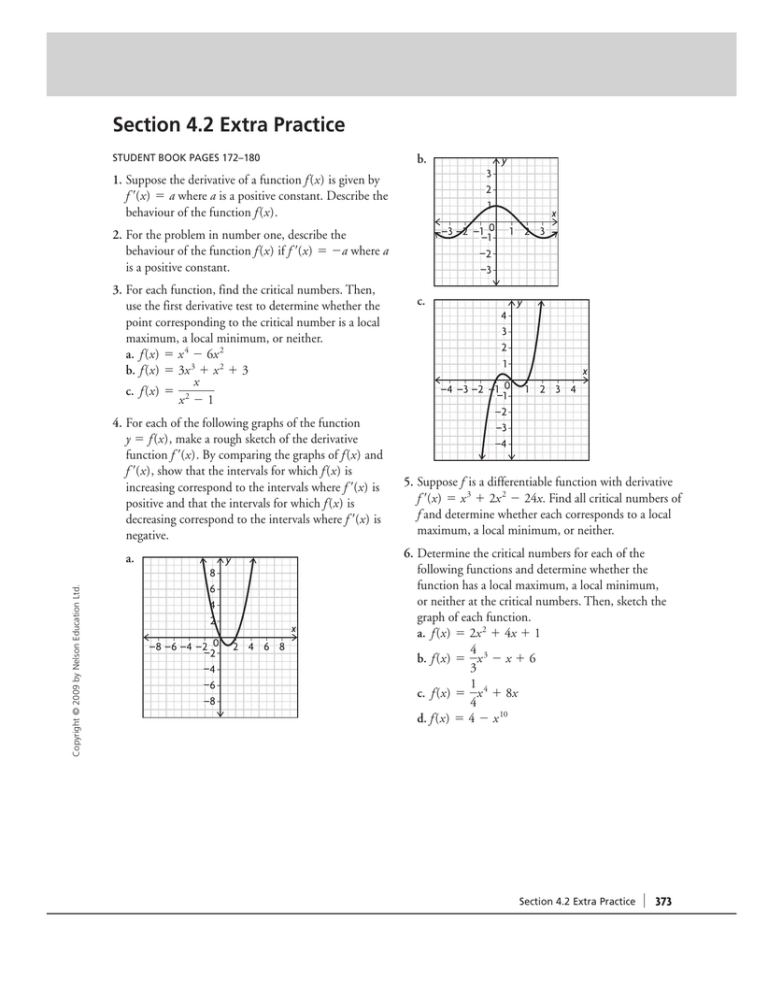
Section 4.2 Extra Practice STUDENT BOOK PAGES 172–180 b. 1. Suppose the derivative of a function f (x) is given by f ⬘(x) ⫽ a where a is a positive constant. Describe the behaviour of the function f (x). 4. For each of the following graphs of the function y ⫽ f (x), make a rough sketch of the derivative function f ⬘(x). By comparing the graphs of f (x) and f ⬘(x), show that the intervals for which f (x) is increasing correspond to the intervals where f ⬘(x) is positive and that the intervals for which f (x) is decreasing correspond to the intervals where f ⬘(x) is negative. Copyright © 2009 by Nelson Education Ltd. a. 8 6 4 2 –8 –6 –4 –2 0 –2 –4 –6 –8 y x 2 4 6 8 y x –3 –2 –1 0 –1 –2 –3 2. For the problem in number one, describe the behaviour of the function f (x) if f ⬘(x) ⫽ ⫺a where a is a positive constant. 3. For each function, find the critical numbers. Then, use the first derivative test to determine whether the point corresponding to the critical number is a local maximum, a local minimum, or neither. a. f (x) ⫽ x 4 ⫺ 6x 2 b. f (x) ⫽ 3x 3 ⫹ x 2 ⫹ 3 x c. f (x) ⫽ 2 x ⫺1 3 2 1 c. 1 4 3 2 1 –4 –3 –2 –1 0 –1 –2 –3 –4 2 3 y x 1 2 3 4 5. Suppose f is a differentiable function with derivative f ⬘(x) ⫽ x 3 ⫹ 2x 2 ⫺ 24x. Find all critical numbers of f and determine whether each corresponds to a local maximum, a local minimum, or neither. 6. Determine the critical numbers for each of the following functions and determine whether the function has a local maximum, a local minimum, or neither at the critical numbers. Then, sketch the graph of each function. a. f (x) ⫽ 2x 2 ⫹ 4x ⫹ 1 4 b. f (x) ⫽ x 3 ⫺ x ⫹ 6 3 1 c. f (x) ⫽ x 4 ⫹ 8x 4 d. f (x) ⫽ 4 ⫺ x 10 Section 4.2 Extra Practice 373


