Effects of Climate Change on Blooming Times at Flat Iron... Methods Conclusions Introduction
advertisement
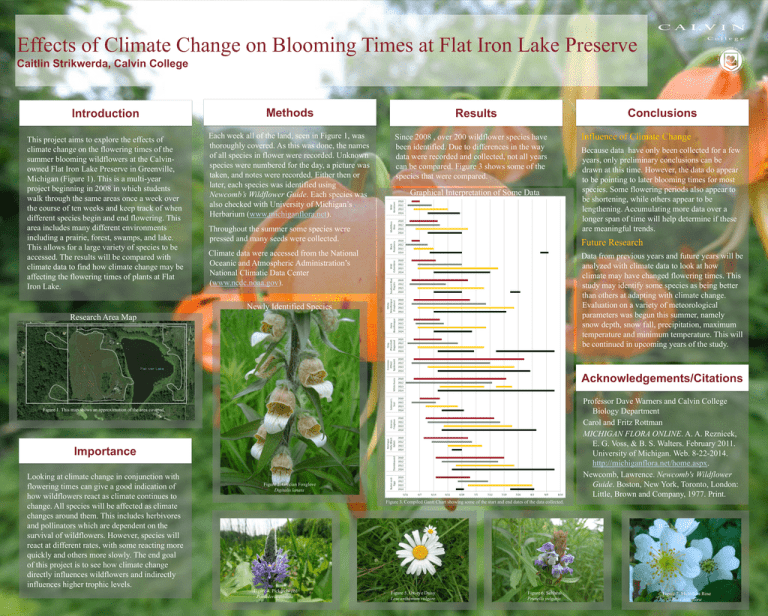
Effects of Climate Change on Blooming Times at Flat Iron Lake Preserve Caitlin Strikwerda, Calvin College Introduction Methods This project aims to explore the effects of climate change on the flowering times of the summer blooming wildflowers at the Calvinowned Flat Iron Lake Preserve in Greenville, Michigan (Figure 1). This is a multi-year project beginning in 2008 in which students walk through the same areas once a week over the course of ten weeks and keep track of when different species begin and end flowering. This area includes many different environments including a prairie, forest, swamps, and lake. This allows for a large variety of species to be accessed. The results will be compared with climate data to find how climate change may be affecting the flowering times of plants at Flat Iron Lake. Each week all of the land, seen in Figure 1, was thoroughly covered. As this was done, the names of all species in flower were recorded. Unknown species were numbered for the day, a picture was taken, and notes were recorded. Either then or later, each species was identified using Newcomb’s Wildflower Guide. Each species was also checked with University of Michigan’s Herbarium (www.michiganflora.net). Conclusions Results Since 2008 , over 200 wildflower species have been identified. Due to differences in the way data were recorded and collected, not all years can be compared. Figure 3 shows some of the species that were compared. Graphical Interpretation of Some Data Throughout the summer some species were pressed and many seeds were collected. Influence of Climate Change Because data have only been collected for a few years, only preliminary conclusions can be drawn at this time. However, the data do appear to be pointing to later blooming times for most species. Some flowering periods also appear to be shortening, while others appear to be lengthening. Accumulating more data over a longer span of time will help determine if these are meaningful trends. Future Research Climate data were accessed from the National Oceanic and Atmospheric Administration’s National Climatic Data Center (www.ncdc.noaa.gov). Data from previous years and future years will be analyzed with climate data to look at how climate may have changed flowering times. This study may identify some species as being better than others at adapting with climate change. Evaluation on a variety of meteorological parameters was begun this summer, namely snow depth, snow fall, precipitation, maximum temperature and minimum temperature. This will be continued in upcoming years of the study. Newly Identified Species Research Area Map Acknowledgements/Citations Professor Dave Warners and Calvin College Biology Department Carol and Fritz Rottman MICHIGAN FLORA ONLINE. A. A. Reznicek, E. G. Voss, & B. S. Walters. February 2011. University of Michigan. Web. 8-22-2014. http://michiganflora.net/home.aspx. Newcomb, Lawrence. Newcomb's Wildflower Guide. Boston, New York, Toronto, London: Little, Brown and Company, 1977. Print. Figure 1. This map shows an approximation of the area covered. Importance Looking at climate change in conjunction with flowering times can give a good indication of how wildflowers react as climate continues to change. All species will be affected as climate changes around them. This includes herbivores and pollinators which are dependent on the survival of wildflowers. However, species will react at different rates, with some reacting more quickly and others more slowly. The end goal of this project is to see how climate change directly influences wildflowers and indirectly influences higher trophic levels. Figure 2. Grecian Foxglove Digitalis lanata Figure 3. Compiled Gantt Chart showing some of the start and end dates of the data collected. Figure 4. Pickerelweed Pontederia cordata Figure 5. Ox-eye Daisy Leucanthemum vulgare Figure 6. Selfheal Prunella vulgaris Figure 7. Multiflora Rose Rosa multiflora
