Single-Assessment Institution Level Pass-Rate Data: Regular Teacher Preparation Program
advertisement
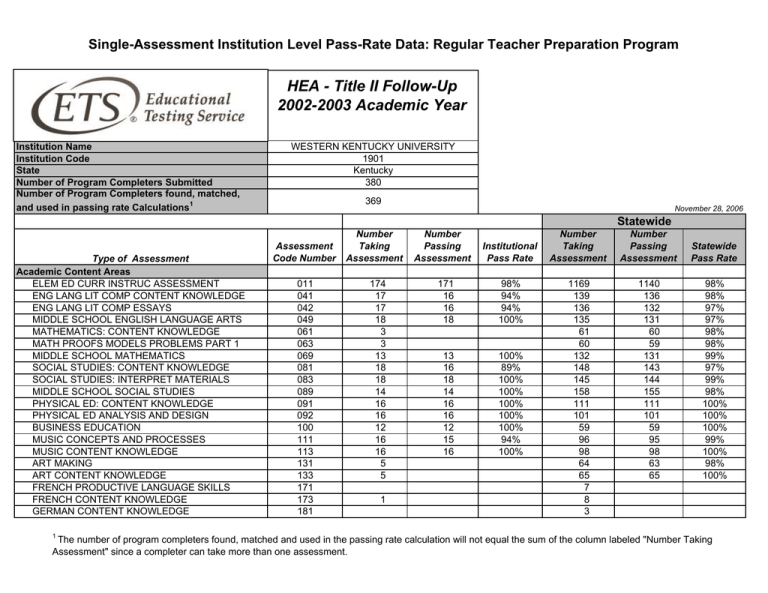
Single-Assessment Institution Level Pass-Rate Data: Regular Teacher Preparation Program HEA - Title II Follow-Up 2002-2003 Academic Year Institution Name Institution Code State Number of Program Completers Submitted Number of Program Completers found, matched, and used in passing rate Calculations1 WESTERN KENTUCKY UNIVERSITY 1901 Kentucky 380 369 November 28, 2006 Statewide Type of Assessment Academic Content Areas ELEM ED CURR INSTRUC ASSESSMENT ENG LANG LIT COMP CONTENT KNOWLEDGE ENG LANG LIT COMP ESSAYS MIDDLE SCHOOL ENGLISH LANGUAGE ARTS MATHEMATICS: CONTENT KNOWLEDGE MATH PROOFS MODELS PROBLEMS PART 1 MIDDLE SCHOOL MATHEMATICS SOCIAL STUDIES: CONTENT KNOWLEDGE SOCIAL STUDIES: INTERPRET MATERIALS MIDDLE SCHOOL SOCIAL STUDIES PHYSICAL ED: CONTENT KNOWLEDGE PHYSICAL ED ANALYSIS AND DESIGN BUSINESS EDUCATION MUSIC CONCEPTS AND PROCESSES MUSIC CONTENT KNOWLEDGE ART MAKING ART CONTENT KNOWLEDGE FRENCH PRODUCTIVE LANGUAGE SKILLS FRENCH CONTENT KNOWLEDGE GERMAN CONTENT KNOWLEDGE 1 Assessment Code Number 011 041 042 049 061 063 069 081 083 089 091 092 100 111 113 131 133 171 173 181 Number Taking Assessment 174 17 17 18 3 3 13 18 18 14 16 16 12 16 16 5 5 1 Number Passing Assessment Institutional Pass Rate 171 16 16 18 98% 94% 94% 100% 13 16 18 14 16 16 12 15 16 100% 89% 100% 100% 100% 100% 100% 94% 100% Number Taking Assessment Number Passing Assessment Statewide Pass Rate 1169 139 136 135 61 60 132 148 145 158 111 101 59 96 98 64 65 7 8 3 1140 136 132 131 60 59 131 143 144 155 111 101 59 95 98 63 65 98% 98% 97% 97% 98% 98% 99% 97% 99% 98% 100% 100% 100% 99% 100% 98% 100% The number of program completers found, matched and used in the passing rate calculation will not equal the sum of the column labeled "Number Taking Assessment" since a completer can take more than one assessment. Single-Assessment Institution Level Pass-Rate Data: Regular Teacher Preparation Program HEA - Title II Follow-Up 2002-2003 Academic Year Institution Name Institution Code State Number of Program Completers Submitted Number of Program Completers found, matched, and used in passing rate Calculations1 WESTERN KENTUCKY UNIVERSITY 1901 Kentucky 380 369 November 28, 2006 Statewide Type of Assessment SPANISH CONTENT KNOWLEDGE SPANISH PRODUCTIVE LANGUAGE SKILLS BIOLOGY CONTENT KNOWLEDGE PART 1 BIOLOGY CONTENT ESSAYS CHEMISTRY CONTENT KNOWLEDGE PHYSICS CONTENT KNOWLEDGE GENERAL SCI CONTENT KNOWL PART 2 MIDDLE SCHOOL SCIENCE Other Content Areas TECHNOLOGY EDUCATION FAMILY AND CONSUMER SCIENCES HEALTH EDUCATION AGRICULTURE Teaching Special Populations ED OF DEAF & HARD OF HEARING SE STUDENTS W/MENTAL RETARDATION SPEECH-LANGUAGE PATHOLOGY SE APPLIC OF CORE PRINCIPLES ACROSS SE BEHAVIORAL/EMOTIONAL 1 Assessment Code Number 191 192 231 233 241 261 432 439 Number Taking Assessment 5 5 5 5 1 1 2 9 Number Passing Assessment Institutional Pass Rate Number Taking Assessment 22 22 59 56 10 6 15 84 Number Passing Assessment 20 20 57 55 10 Statewide Pass Rate 91% 91% 97% 98% 100% 15 84 100% 100% 050 120 550 700 3 6 8 6 22 69 32 21 62 32 95% 90% 100% 271 321 330 352 371 5 9 56 44 5 23 47 295 231 23 47 284 227 100% 100% 96% 98% 54 44 96% 100% The number of program completers found, matched and used in the passing rate calculation will not equal the sum of the column labeled "Number Taking Assessment" since a completer can take more than one assessment. Aggregate and Summary Institution-Level Pass-Rate Data: Regular Teacher Preparation Program HEA - Title II Follow-Up 2002-2003 Academic Year Institution Name Institution Code State Number of Program Completers Submitted Number of Program Completers found, matched, and used in passing rate Calculations1 WESTERN KENTUCKY UNIVERSITY 1901 Kentucky 380 369 November 28, 2006 Statewide Type of Assessment 2 Number Taking Assessment 3 Number Passing Assessment 4 Institutional Pass Rate Number Taking Assessment 3 Number Passing Assessment 4 Statewide Pass Rate Aggregate - Basic Skills Aggregate - Professional Knowledge Aggregate - Academic Content Areas (Math, English, Biology, etc.) 328 320 98% 2455 2399 98% Aggregate - Other Content Areas (Career/Technical Education, Health Educations, etc.) 17 17 100% 129 120 93% Aggregate - Teaching Special Populations (Special Education, ELS, etc.) 58 56 97% 309 296 96% 369 359 97% 2500 2439 98% Aggregate - Performance Assessments Summary Totals and Pass Rates5 1 The number of program completers found, matched and used in the passing rate calculation will not equal the sum of the column labeled "Number Taking Assessment" since a completer can take more than one assessment. 2 Institutions and/or States did not require the assessments within an aggregate where data cells are blank. 3 Number of completers who took one or more tests in a category and within their area of specialization. 4 Number who passed all tests they took in a category and within their area of specialization. 5 Summary Totals and Pass Rate: Number of completers who successfully completed one or more tests across all categories used by the state for licensure and the total passrate.
