5-2A How to get current data from the web and import... The National Oceanic and Atmospheric Administration posts the most recent...
advertisement

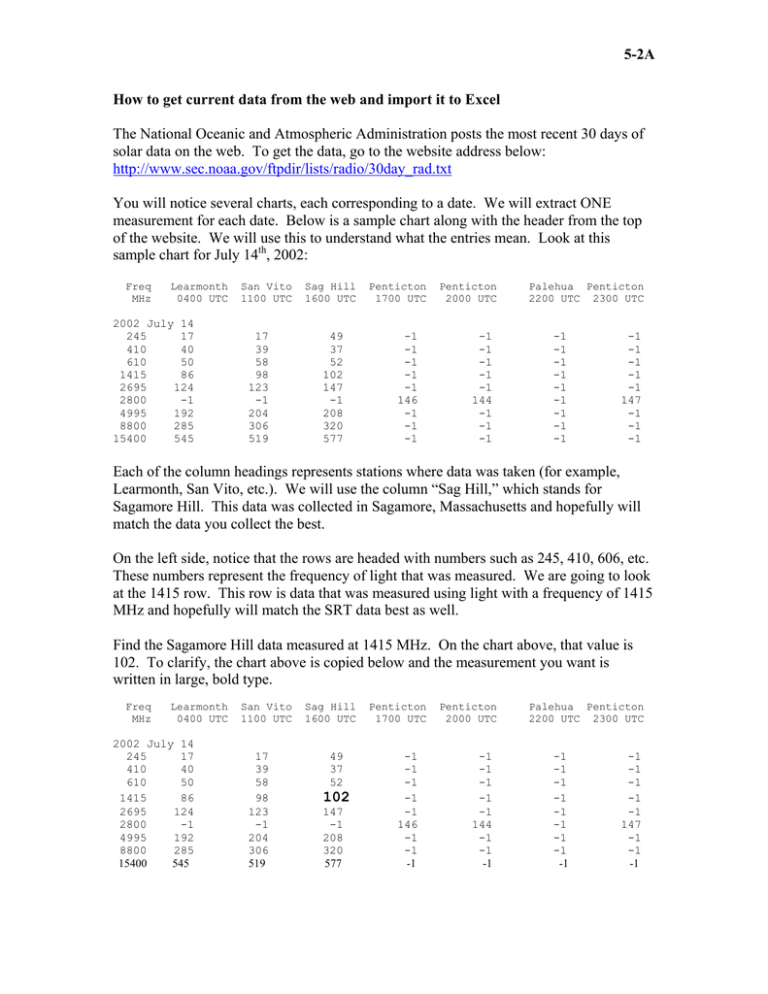
5-2A How to get current data from the web and import it to Excel The National Oceanic and Atmospheric Administration posts the most recent 30 days of solar data on the web. To get the data, go to the website address below: http://www.sec.noaa.gov/ftpdir/lists/radio/30day_rad.txt You will notice several charts, each corresponding to a date. We will extract ONE measurement for each date. Below is a sample chart along with the header from the top of the website. We will use this to understand what the entries mean. Look at this sample chart for July 14th, 2002: Freq MHz Learmonth 0400 UTC 2002 July 14 245 17 410 40 610 50 1415 86 2695 124 2800 -1 4995 192 8800 285 15400 545 San Vito 1100 UTC 17 39 58 98 123 -1 204 306 519 Sag Hill 1600 UTC 49 37 52 102 147 -1 208 320 577 Penticton 1700 UTC -1 -1 -1 -1 -1 146 -1 -1 -1 Penticton 2000 UTC -1 -1 -1 -1 -1 144 -1 -1 -1 Palehua Penticton 2200 UTC 2300 UTC -1 -1 -1 -1 -1 -1 -1 -1 -1 -1 -1 -1 -1 -1 147 -1 -1 -1 Each of the column headings represents stations where data was taken (for example, Learmonth, San Vito, etc.). We will use the column “Sag Hill,” which stands for Sagamore Hill. This data was collected in Sagamore, Massachusetts and hopefully will match the data you collect the best. On the left side, notice that the rows are headed with numbers such as 245, 410, 606, etc. These numbers represent the frequency of light that was measured. We are going to look at the 1415 row. This row is data that was measured using light with a frequency of 1415 MHz and hopefully will match the SRT data best as well. Find the Sagamore Hill data measured at 1415 MHz. On the chart above, that value is 102. To clarify, the chart above is copied below and the measurement you want is written in large, bold type. Freq MHz Learmonth 0400 UTC 2002 July 14 245 17 410 40 610 50 1415 86 2695 124 2800 -1 4995 192 8800 285 15400 545 San Vito 1100 UTC 17 39 58 98 123 -1 204 306 519 Sag Hill 1600 UTC 49 37 52 102 147 -1 208 320 577 Penticton 1700 UTC -1 -1 -1 -1 -1 146 -1 -1 -1 Penticton 2000 UTC -1 -1 -1 -1 -1 144 -1 -1 -1 Palehua Penticton 2200 UTC 2300 UTC -1 -1 -1 -1 -1 -1 -1 -1 -1 -1 -1 -1 -1 -1 147 -1 -1 -1 5-2A The number is in solar flux units (but we won’t worry about the units too much). If there is a “-1” entry, that means no data was collected. Is this is the case, do not include that date in your data table. Record the date and the measurement in the table on the next page. Do this for all days that you made SRT measurements. Eventually, we will also graph the data you take with the SRT and compare the results as well as try to determine the period of rotation of the sun.


