Evaluation of Techniques for Slice Sensitivity Profile Measurement and Analysis
advertisement
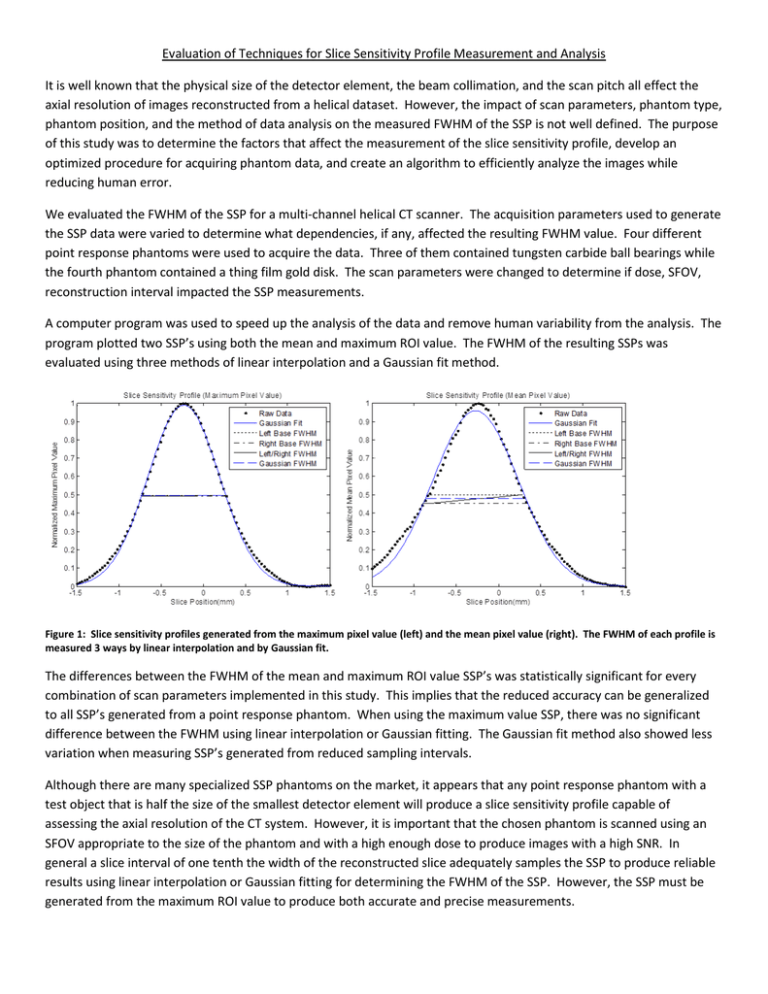
Evaluation of Techniques for Slice Sensitivity Profile Measurement and Analysis It is well known that the physical size of the detector element, the beam collimation, and the scan pitch all effect the axial resolution of images reconstructed from a helical dataset. However, the impact of scan parameters, phantom type, phantom position, and the method of data analysis on the measured FWHM of the SSP is not well defined. The purpose of this study was to determine the factors that affect the measurement of the slice sensitivity profile, develop an optimized procedure for acquiring phantom data, and create an algorithm to efficiently analyze the images while reducing human error. We evaluated the FWHM of the SSP for a multi-channel helical CT scanner. The acquisition parameters used to generate the SSP data were varied to determine what dependencies, if any, affected the resulting FWHM value. Four different point response phantoms were used to acquire the data. Three of them contained tungsten carbide ball bearings while the fourth phantom contained a thing film gold disk. The scan parameters were changed to determine if dose, SFOV, reconstruction interval impacted the SSP measurements. A computer program was used to speed up the analysis of the data and remove human variability from the analysis. The program plotted two SSP’s using both the mean and maximum ROI value. The FWHM of the resulting SSPs was evaluated using three methods of linear interpolation and a Gaussian fit method. Figure 1: Slice sensitivity profiles generated from the maximum pixel value (left) and the mean pixel value (right). The FWHM of each profile is measured 3 ways by linear interpolation and by Gaussian fit. The differences between the FWHM of the mean and maximum ROI value SSP’s was statistically significant for every combination of scan parameters implemented in this study. This implies that the reduced accuracy can be generalized to all SSP’s generated from a point response phantom. When using the maximum value SSP, there was no significant difference between the FWHM using linear interpolation or Gaussian fitting. The Gaussian fit method also showed less variation when measuring SSP’s generated from reduced sampling intervals. Although there are many specialized SSP phantoms on the market, it appears that any point response phantom with a test object that is half the size of the smallest detector element will produce a slice sensitivity profile capable of assessing the axial resolution of the CT system. However, it is important that the chosen phantom is scanned using an SFOV appropriate to the size of the phantom and with a high enough dose to produce images with a high SNR. In general a slice interval of one tenth the width of the reconstructed slice adequately samples the SSP to produce reliable results using linear interpolation or Gaussian fitting for determining the FWHM of the SSP. However, the SSP must be generated from the maximum ROI value to produce both accurate and precise measurements. FWHM vs Sampling Interval 0.625 1.25 Selected Thickness (mm) 0.98 1.40 Nominal Thickness (mm) Interval = Slice Thickness/20 1.00 1.41 Measured FWHM (mm) 2.2% 0.7% Percent Error 0.002 0.020 Standard Deviation (mm) --p-value Interval = Slice Thickness/10 1.00 1.41 Measured FWHM (mm) 2.3% 0.03 Percent Error 0.002 0.005 Standard Deviation (mm) 0.4455 0.9435 p-value Interval = Slice Thickness/5 1.00 1.41 Measured FWHM (mm) 1.6% 0.8% Percent Error 0.001 0.005 Standard Deviation (mm) 0.0020 0.4790 p-value 2.50 2.72 5.00 6.01 Selected Thickness (mm) Nominal Thickness (mm) 3.02 11.1% 0.009 -- 6.39 6.4% 0.018 -- Measured FWHM (mm) Percent Error Standard Deviation (mm) p-value 3.02 11.2% 0.006 0.5592 6.41 6.7% 0.042 0.3339 Measured FWHM (mm) Percent Error Standard Deviation (mm) p-value 2.99 10.1% 0.006 0.0011 6.42 6.9% 0.041 0.2348 Measured FWHM (mm) Percent Error Standard Deviation (mm) p-value Mean vs. Max ROI value Selected Thickness (mm) Nominal Thickness (mm) Mean ROI Value (mm) Max ROI Value (mm) % Error (Mean) % Error (Max) Mean ROI Value (mm) Max ROI Value (mm) % Error (Mean) % Error (Max) Mean ROI Value (mm) Max ROI Value (mm) % Error (Mean) % Error (Max) Mean ROI Value (mm) Max ROI Value (mm) % Error (Mean) % Error (Max) 0.625 0.98 ROI1 1.19 1.00 21.2% 2.1% ROI2 1.22 1.00 24.6% 2.0% ROI3 1.27 1.00 29.4% 2.5% ROI4 1.28 1.00 31.0% 2.0% 1.25 1.40 2.50 2.72 5.00 6.01 1.68 1.42 20.1% 1.2% 3.41 3.02 25.3% 11.2% 6.61 6.38 10.1% 6.1% 1.61 1.39 15.2% 0.4% 4.14 2.98 52.1% 9.6% 8.16 6.26 35.7% 4.1% 1.77 1.41 26.7% 0.9% 3.48 3.02 28.0% 10.9% 6.78 6.35 12.7% 5.6% 1.74 1.41 24.6% 0.9% 3.27 3.00 20.1% 10.3% 6.67 6.29 11.0% 4.6% FWHM vs Phantom Selected Thickness (mm) 0.625 1.25 2.50 Nominal Thickness (mm) 0.98 1.40 2.72 Fluke CT-SSP Phantom Measured FWHM (mm) 1.00 1.41 3.02 Percent Error 2.2% 0.7% 11.1% 0.005 0.009 Standard Deviation (mm) 0.002 ---p-value Gammex 464 (ACR Phantom) 0.98 1.39 3.04 Measured FWHM (mm) 0.1% 0.7% 11.8% Percent Error 0.020 0.035 Standard Deviation (mm) 0.016 0.0324 0.0965 0.2603 p-value CatPhan Model 500 0.97 1.38 2.98 Measured FWHM (mm) 0.7% 1.5% 9.6% Percent Error 0.017 0.014 Standard Deviation (mm) 0.009 0.0021 0.0150 0.0012 p-value Kagaku Phantom 0.99 1.39 3.06 Measured FWHM (mm) 1.0% 0.5% 12.5% Percent Error 0.014 0.017 Standard Deviation (mm) 0.016 0.1789 0.0567 4.27E-05 p-value 5.00 6.01 6.39 6.4% 0.018 -6.43 6.9% 0.083 0.4085 6.31 5.0% 0.115 0.1848 6.52 8.5% 0.048 0.0024 FWHM vs SFOV 0.625 1.25 0.98 1.40 Head 1.00 1.41 2.2% 0.7% 0.002 0.020 --Small Body 1.00 1.39 1.8% 0.4% 0.003 0.005 0.0915 0.0010 Large Body 1.01 1.41 2.9% 0.4% 0.004 0.005 0.0320 0.1801 FWHM Analysis 0.625 1.25 0.98 1.40 Left Based FWHM Measured FWHM (mm) 0.97 1.38 Percent Error 1.1% 1.7% 0.015 0.021 Standard Deviation (mm) 0.3351 0.3135 p-value Right Based FWHM 0.97 1.40 Measured FWHM (mm) 0.7% 0.03 Percent Error 0.016 0.018 Standard Deviation (mm) 0.5864 0.4405 p-value Two Sided FWHM 0.97 1.39 Measured FWHM (mm) Percent Error 0.9% 0.9% Standard Deviation (mm) 0.016 0.019 0.4478 0.8807 p-value Gaussian Fit FWHM 0.98 1.39 Measured FWHM (mm) 0.1% 0.7% Percent Error 0.016 0.020 Standard Deviation (mm) --p-value Selected Thickness (mm) Nominal Thickness (mm) FWHM vs. Dose Selected Thickness (mm) 0.625 1.25 Nominal Thickness (mm) 0.98 1.40 120 kVp @ 325 mA Measured FWHM (mm) 0.98 1.39 0.1% 0.7% Percent Error 0.016 0.020 Standard Deviation (mm) --p-value 120 kVp @ 150 mA 0.97 1.36 Measured FWHM (mm) 1.4% 0.03 Percent Error 0.019 0.020 Standard Deviation (mm) 0.2831 0.1281 p-value 120 kVp @ 75 mA 0.96 1.35 Measured FWHM (mm) 1.9% 3.5% Percent Error 0.012 0.021 Standard Deviation (mm) 0.0795 0.02 p-value 80 kVp @ 325 mA 0.96 1.35 Measured FWHM (mm) 1.7% 3.9% Percent Error 0.019 1.346 Standard Deviation (mm) 0.1753 0.0182 p-value 2.50 2.72 5.00 6.01 3.02 11.1% 0.009 -- 6.39 6.4% 0.018 -- 3.03 11.5% 0.010 0.0841 6.27 4.4% 0.043 0.0019 2.98 9.6% 0.038 0.0733 6.01 0.0% 0.172 0.0073 2.50 2.72 5.00 6.01 2.98 9.7% 0.041 0.0410 6.23 3.6% 0.079 0.0044 3.05 12.1% 0.055 0.8380 6.35 5.6% 0.146 0.3305 3.02 10.9% 0.046 0.3417 6.29 4.6% 0.113 0.0576 3.04 11.8% 0.035 -- 6.43 6.9% 0.083 -- 2.50 2.72 5.00 6.01 3.04 11.8% 0.035 -- 6.43 6.9% 0.083 -- 3.00 10.2% 0.041 0.1039 6.36 5.8% 0.166 0.4443 2.93 7.7% 0.043 0.0020 6.31 5.0% 0.165 0.2082 2.93 7.6% 0.111 8.30E-02 6.23 3.6% 0.302 0.2186
