Crafton Hills College Educational Master Planning Committee Possible Quantitative Effective Indicators (QEIs)
advertisement

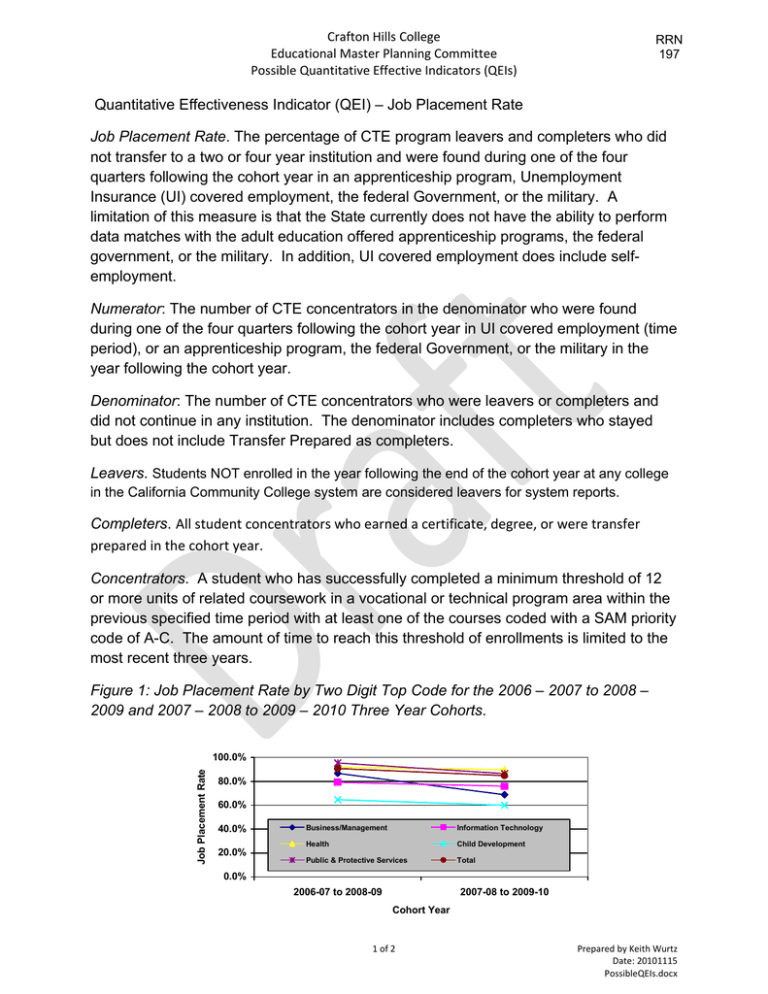
Crafton Hills College Educational Master Planning Committee Possible Quantitative Effective Indicators (QEIs) RRN 197 Quantitative Effectiveness Indicator (QEI) – Job Placement Rate Job Placement Rate. The percentage of CTE program leavers and completers who did not transfer to a two or four year institution and were found during one of the four quarters following the cohort year in an apprenticeship program, Unemployment Insurance (UI) covered employment, the federal Government, or the military. A limitation of this measure is that the State currently does not have the ability to perform data matches with the adult education offered apprenticeship programs, the federal government, or the military. In addition, UI covered employment does include selfemployment. Numerator: The number of CTE concentrators in the denominator who were found during one of the four quarters following the cohort year in UI covered employment (time period), or an apprenticeship program, the federal Government, or the military in the year following the cohort year. Denominator: The number of CTE concentrators who were leavers or completers and did not continue in any institution. The denominator includes completers who stayed but does not include Transfer Prepared as completers. Leavers. Students NOT enrolled in the year following the end of the cohort year at any college in the California Community College system are considered leavers for system reports. Completers. All student concentrators who earned a certificate, degree, or were transfer prepared in the cohort year. Concentrators. A student who has successfully completed a minimum threshold of 12 or more units of related coursework in a vocational or technical program area within the previous specified time period with at least one of the courses coded with a SAM priority code of A-C. The amount of time to reach this threshold of enrollments is limited to the most recent three years. Figure 1: Job Placement Rate by Two Digit Top Code for the 2006 – 2007 to 2008 – 2009 and 2007 – 2008 to 2009 – 2010 Three Year Cohorts. Job Placement Rate 100.0% 80.0% 60.0% 40.0% 20.0% Business/Management Information Technology Health Child Development Public & Protective Services Total 0.0% 2006-07 to 2008-09 2007-08 to 2009-10 Cohort Year 1 of 2 Prepared by Keith Wurtz Date: 20101115 PossibleQEIs.docx Table 1: Job Placement Rate by Four Digit Top Code for the 2006 – 2007 to 2008 – 2009 and 2007 – 2008 to 2009 – 2010 Three Year Cohorts. 4 Digit TOP Code / Program 0502 Accounting 0506 Business Management 0702 Computer Information Systems 0707 Computer Software Development 0799 Other Information Technology 1210 Respiratory Care/Therapy 1225 Radiologic Technology 1250 Emergency Medical Services 1251 Paramedic 1305 Child Development/early Care & Education 2105 Administration of Justice 2133 Fire Technology Total Job Placement Rate 2006-2007 to 2008-2009 Count Total Rate 10 11 90.91 16 19 84.21 14 18 77.78 5 6 83.33 0 0 0.00 50 54 92.59 9 9 100.0 232 257 90.27 40 40 100.0 11 17 64.71 10 11 90.91 74 77 96.10 471 519 90.75 2007-2008 to 2009-2010 Count Total Rate 15 22 68.18 7 10 70.00 13 16 81.25 0 0 0.00 6 9 66.67 55 65 84.62 11 13 84.62 78 85 91.76 25 25 100.00 9 15 60.00 8 12 66.67 69 77 89.61 296 349 84.81 Note: Prior year cohorts are not available because of the transition of VATEA to Perkins and the change in methodology. “Count” refers to the number of students who were found to have been employed, “Total” refers to the number of students identified in the cohort, and “Rate” is the number of students employed divided by the number of students in the cohort (i.e. Job Placement Rate). Table 1A: Possible Five Year Goals using the Two Year Average Job Placement Rate as a Baseline. Two Year Average 2 Digit TOP Code / Program Count Total 05 Business 07 IT 12 Health 13 Child Develop 21 Public Services Overall 48 38 500 20 161 767 62 49 548 32 177 868 Rate .10 Effect Size* State Target 77.4 77.6 91.2 62.5 91.0 88.4 82.25 81.63 93.98 68.75 93.79 91.47 81.80 81.80 81.80 81.80 81.80 81.80 District Negotiated Target 80.33 80.33 80.33 80.33 80.33 80.33 Maintain/Reach Success Rate Only target for the overall job placement rate is recommended 90.00% Note. “Count” refers to the number of students who were found to have been employed, “Total” refers to the number of students identified in the cohort, and “Rate” is the number of students employed divided by the number of students in the cohort (i.e. Job Placement Rate). Yellow – recommended ambitious but reasonable five year goal. *The Effect Size (ES) goal was set by identifying a .10 effect size increase in each job placement rate. A .10 effect size corresponds to a Pearson r of .05. The effect size represents the magnitude of the difference between the target and the baseline measure. Using an effect size increases the likelihood that the difference is not only statistically significant but practical as well. 2 of 2 Prepared by Keith Wurtz Date: 20101115, Revised: 20101214 PossibleQEIs.docx


