5.8 Modeling with Quadratic Functions vertex form
advertisement
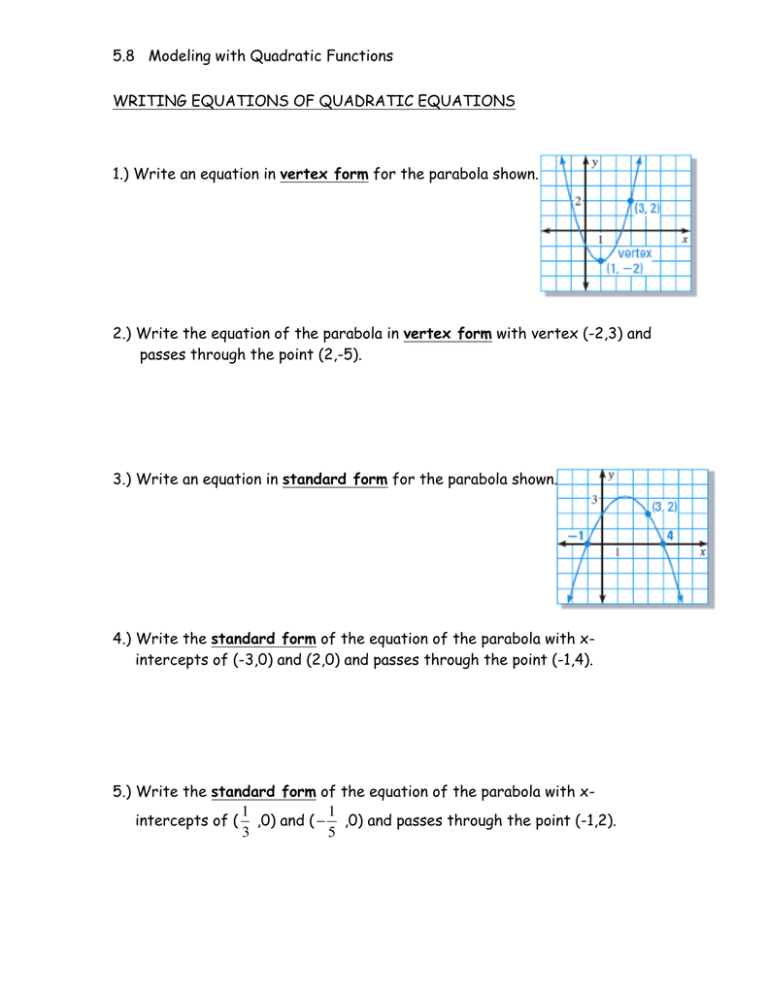
5.8 Modeling with Quadratic Functions WRITING EQUATIONS OF QUADRATIC EQUATIONS 1.) Write an equation in vertex form for the parabola shown. 2.) Write the equation of the parabola in vertex form with vertex (-2,3) and passes through the point (2,-5). 3.) Write an equation in standard form for the parabola shown. 4.) Write the standard form of the equation of the parabola with xintercepts of (-3,0) and (2,0) and passes through the point (-1,4). 5.) Write the standard form of the equation of the parabola with x1 1 intercepts of ( ,0) and ( − ,0) and passes through the point (-1,2). 3 5 5.8 Modeling with Quadratic Functions 6.) A study compared the speed x (in miles per hour) and the average fuel economy y ( in miles per gallon) for cars. The results are shown in the table. 15 20 25 30 Speed,x 22.3 25.5 27.5 29 Fuel economy,y 35 40 45 50 55 60 65 70 28.8 30 29.9 30.2 30.4 28.8 27.4 25.3 a.) Graph a scatter plot of Fuel Economy vs. Speed on your graphing calculator. Do you think that a linear or quadratic regression model fits the data better? b.) Find a linear regression model for the data using your graphing calculator. Report the equation of the linear model below. Report the r2 value for this model. c.) Find a quadratic regression model for the data using your graphing calculator. Report the equation of the quadratic model below. Report the r2 value for this model. d.) Using the model that fits the data best, predict the fuel economy for a car travelling at a speed of 80 mph. e.) Find the speed that maximizes fuel economy.
