Modeling Real World Data with Trig Functions Ferris Wheel Example (From Yesterday)
advertisement
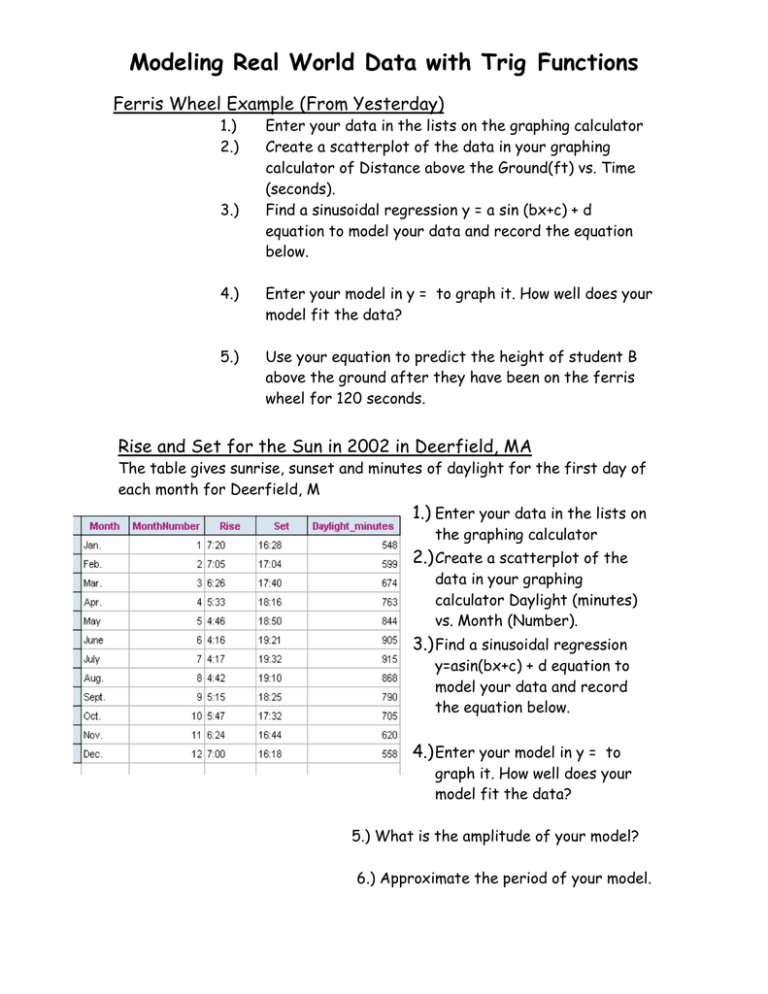
Modeling Real World Data with Trig Functions Ferris Wheel Example (From Yesterday) 1.) 2.) 3.) Enter your data in the lists on the graphing calculator Create a scatterplot of the data in your graphing calculator of Distance above the Ground(ft) vs. Time (seconds). Find a sinusoidal regression y = a sin (bx+c) + d equation to model your data and record the equation below. 4.) Enter your model in y = to graph it. How well does your model fit the data? 5.) Use your equation to predict the height of student B above the ground after they have been on the ferris wheel for 120 seconds. Rise and Set for the Sun in 2002 in Deerfield, MA The table gives sunrise, sunset and minutes of daylight for the first day of each month for Deerfield, M 1.) Enter your data in the lists on the graphing calculator 2.) Create a scatterplot of the data in your graphing calculator Daylight (minutes) vs. Month (Number). 3.) Find a sinusoidal regression y=asin(bx+c) + d equation to model your data and record the equation below. 4.) Enter your model in y = to graph it. How well does your model fit the data? 5.) What is the amplitude of your model? 6.) Approximate the period of your model. Modeling Real World Data with Trig Functions Refrigerator Data As the temperature inside a refrigerator rises above the temperature set on the thermostat, a compressor turns on and cools the air. When the air is cooled below the thermostat setting, the compressor turns off. The refrigerator slowly warms up and the cycle starts all over again. The table gives the refrigerator temperature in degrees F every minute for 29 minutes. 1.) Enter your data in the lists on the graphing calculator 2.) Create a scatterplot of the data in your graphing calculator of Temperature (°F) vs. Time (minutes). 3.) Find a sinusoidal regression y = a sin (bx+c) + d equation to model your data and record the equation below. 4.) Enter your model in y = to graph it. How well does your model fit the data? 5.) What is the amplitude of your model ? ___________ Interpret the amplitude in the context of the problem. 6.) Approximate the period of your model. ____________ Interpret the period in the context of the problem. 7.) Use your equation to predict the temperature of the refrigerator after 42 minutes. Modeling Real World Data with Trig Functions

