2.12 – More Rational Functions ) (
advertisement
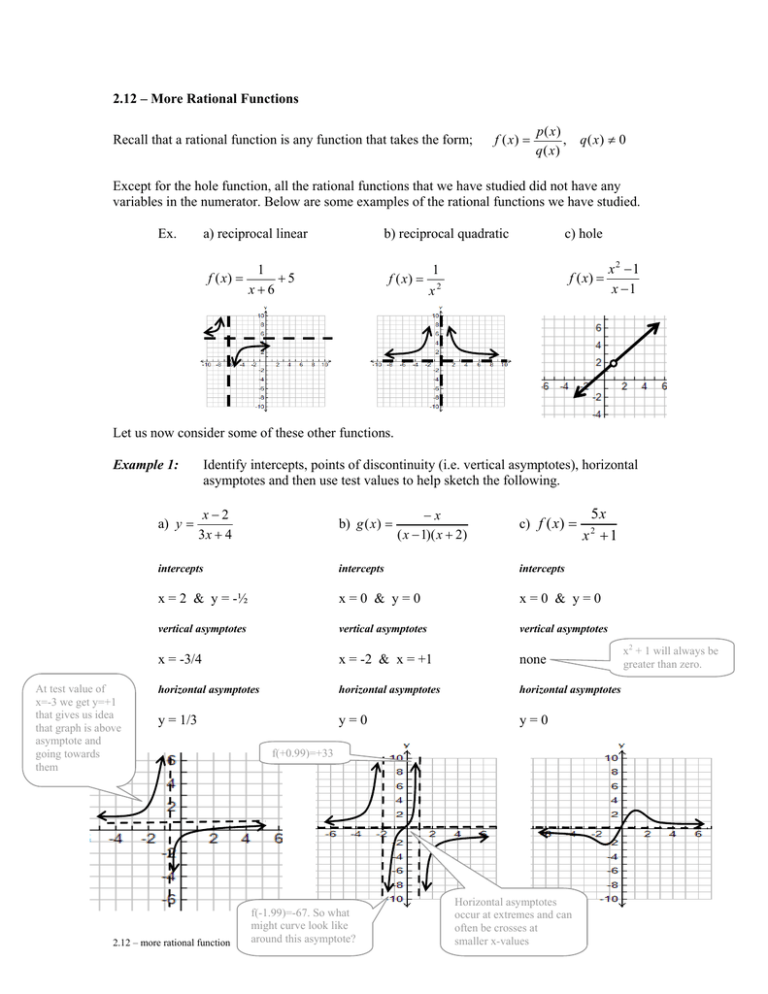
2.12 – More Rational Functions Recall that a rational function is any function that takes the form; f ( x) = p( x) , q( x) ≠ 0 q ( x) Except for the hole function, all the rational functions that we have studied did not have any variables in the numerator. Below are some examples of the rational functions we have studied. Ex. a) reciprocal linear f ( x) = b) reciprocal quadratic 1 +5 x+6 f ( x) = c) hole 1 f ( x) = x2 x2 −1 x −1 Let us now consider some of these other functions. Identify intercepts, points of discontinuity (i.e. vertical asymptotes), horizontal asymptotes and then use test values to help sketch the following. Example 1: a) y = At test value of x=-3 we get y=+1 that gives us idea that graph is above asymptote and going towards them x−2 3x + 4 b) g ( x) = −x ( x − 1)( x + 2) c) f ( x) = 5x x +1 2 intercepts intercepts intercepts x = 2 & y = -½ x=0 & y=0 x=0 & y=0 vertical asymptotes vertical asymptotes vertical asymptotes x = -3/4 x = -2 & x = +1 none horizontal asymptotes horizontal asymptotes horizontal asymptotes y = 1/3 y=0 y=0 2.12 – more rational function f(+0.99)=+33 f(-1.99)=-67. So what might curve look like around this asymptote? Horizontal asymptotes occur at extremes and can often be crosses at smaller x-values x2 + 1 will always be greater than zero. 2.12 – More Rational Functions Practice Questions 1. Identify intercepts, points of discontinuity, asymptotes and then use test values to help sketch the following. x2 − 9 x+4 x d) g ( x) = 2 x −9 x g) m( x) = x −1 2x j) y = x +1 a) f ( x) = b) f ( x) = 2 x2 x2 − 4 c) g ( x) = x2 + 4 x + 4 x+2 e) h( x) = 3x x +2 f) h( x) = 9x x +2 2 2x x −1 − 2x k) f ( x) = x +1 i) y = h) m( x) = a) g ( x) = 2. Sketch the following; 3x x −1 l) f ( x) = x2 − 5x + 6 x 2 − 7 x + 12 2 b) y = x +1 x −1 x3 − 1 4 − x2 3. Find constants a and b that guarantee that the graph of the function defined by h( x ) = ax 2 + 7 3 will have a vertical asymptote at x = ± and a horizontal asymptote at y = -2. 2 5 9 − bx 4. Given the graph below identify; a) intercepts b) asymptotes c) increasing intervals d) decreasing intervals e) discontinuity points f) slope at; i) x = 1 ii) x = 3 iii) x = 4 iv) x = 5 Answers 1. refer to chart below, graphs for a, b, c given, check others on calculator 3. a=50 b=25 4. a) y=5, x=4 b) x=2, y=0 c) 1<x<2 & x>2 d) x<1 e) x=2 f) i) 0 ii) 3/2 iii) 0 iv) 3/2 Intercepts Asymptotes X Y V H a ±3 -9/4 -4 - 1 a) 2.12 – more rational function b 0 0 ±2 2 c -2 ? 2 -2 ? - d 0 0 ±3 0 b) e 0 0 0 f 0 0 0 g 0 0 1 1 h 0 0 1 2 i 0 0 1 3 c) j 0 0 -1 2 k 0 0 -1 -2 l ½ 1 1 2 2.12 - Sketching Practice Sheet 2.12 – more rational function
