Scanning Probe-Based Frequency-Dependent Microrheology of Polymer Gels and Biological Cells
advertisement
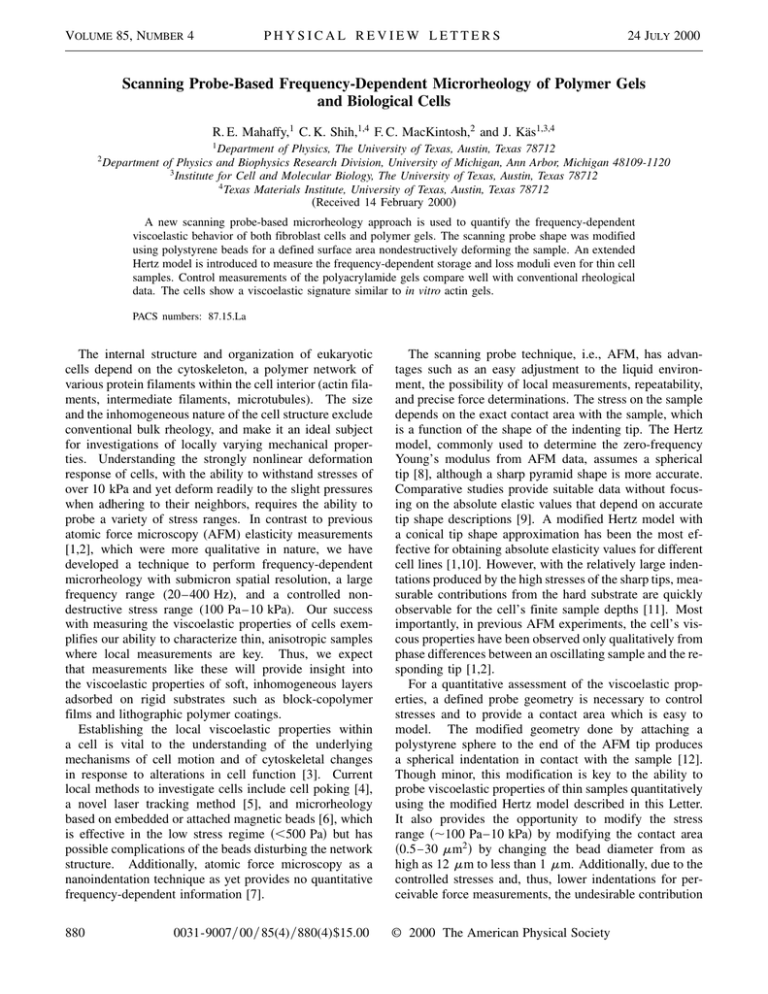
VOLUME 85, NUMBER 4 PHYSICAL REVIEW LETTERS 24 JULY 2000 Scanning Probe-Based Frequency-Dependent Microrheology of Polymer Gels and Biological Cells R. E. Mahaffy,1 C. K. Shih,1,4 F. C. MacKintosh,2 and J. Käs1,3,4 1 2 Department of Physics, The University of Texas, Austin, Texas 78712 Department of Physics and Biophysics Research Division, University of Michigan, Ann Arbor, Michigan 48109-1120 3 Institute for Cell and Molecular Biology, The University of Texas, Austin, Texas 78712 4 Texas Materials Institute, University of Texas, Austin, Texas 78712 (Received 14 February 2000) A new scanning probe-based microrheology approach is used to quantify the frequency-dependent viscoelastic behavior of both fibroblast cells and polymer gels. The scanning probe shape was modified using polystyrene beads for a defined surface area nondestructively deforming the sample. An extended Hertz model is introduced to measure the frequency-dependent storage and loss moduli even for thin cell samples. Control measurements of the polyacrylamide gels compare well with conventional rheological data. The cells show a viscoelastic signature similar to in vitro actin gels. PACS numbers: 87.15.La The internal structure and organization of eukaryotic cells depend on the cytoskeleton, a polymer network of various protein filaments within the cell interior (actin filaments, intermediate filaments, microtubules). The size and the inhomogeneous nature of the cell structure exclude conventional bulk rheology, and make it an ideal subject for investigations of locally varying mechanical properties. Understanding the strongly nonlinear deformation response of cells, with the ability to withstand stresses of over 10 kPa and yet deform readily to the slight pressures when adhering to their neighbors, requires the ability to probe a variety of stress ranges. In contrast to previous atomic force microscopy (AFM) elasticity measurements [1,2], which were more qualitative in nature, we have developed a technique to perform frequency-dependent microrheology with submicron spatial resolution, a large frequency range (20–400 Hz), and a controlled nondestructive stress range (100 Pa–10 kPa). Our success with measuring the viscoelastic properties of cells exemplifies our ability to characterize thin, anisotropic samples where local measurements are key. Thus, we expect that measurements like these will provide insight into the viscoelastic properties of soft, inhomogeneous layers adsorbed on rigid substrates such as block-copolymer films and lithographic polymer coatings. Establishing the local viscoelastic properties within a cell is vital to the understanding of the underlying mechanisms of cell motion and of cytoskeletal changes in response to alterations in cell function [3]. Current local methods to investigate cells include cell poking [4], a novel laser tracking method [5], and microrheology based on embedded or attached magnetic beads [6], which is effective in the low stress regime 共,500 Pa兲 but has possible complications of the beads disturbing the network structure. Additionally, atomic force microscopy as a nanoindentation technique as yet provides no quantitative frequency-dependent information [7]. The scanning probe technique, i.e., AFM, has advantages such as an easy adjustment to the liquid environment, the possibility of local measurements, repeatability, and precise force determinations. The stress on the sample depends on the exact contact area with the sample, which is a function of the shape of the indenting tip. The Hertz model, commonly used to determine the zero-frequency Young’s modulus from AFM data, assumes a spherical tip [8], although a sharp pyramid shape is more accurate. Comparative studies provide suitable data without focusing on the absolute elastic values that depend on accurate tip shape descriptions [9]. A modified Hertz model with a conical tip shape approximation has been the most effective for obtaining absolute elasticity values for different cell lines [1,10]. However, with the relatively large indentations produced by the high stresses of the sharp tips, measurable contributions from the hard substrate are quickly observable for the cell’s finite sample depths [11]. Most importantly, in previous AFM experiments, the cell’s viscous properties have been observed only qualitatively from phase differences between an oscillating sample and the responding tip [1,2]. For a quantitative assessment of the viscoelastic properties, a defined probe geometry is necessary to control stresses and to provide a contact area which is easy to model. The modified geometry done by attaching a polystyrene sphere to the end of the AFM tip produces a spherical indentation in contact with the sample [12]. Though minor, this modification is key to the ability to probe viscoelastic properties of thin samples quantitatively using the modified Hertz model described in this Letter. It also provides the opportunity to modify the stress range 共⬃100 Pa 10 kPa兲 by modifying the contact area 共0.5 30 mm2 兲 by changing the bead diameter from as high as 12 mm to less than 1 mm. Additionally, due to the controlled stresses and, thus, lower indentations for perceivable force measurements, the undesirable contribution 880 © 2000 The American Physical Society 0031-9007兾00兾85(4)兾880(4)$15.00 VOLUME 85, NUMBER 4 PHYSICAL REVIEW LETTERS of the underlying hard substrate is avoided and the thinner samples can be probed. The lower stress range is ideal for fragile materials, and we noted a significantly lowered probability of scraping cells from the substrate and no instances of cell damage by slicing the cell membrane. For quantitative measurements, the exact diameter of each new probe and its precise position with respect to the cantilever tip were measured prior to use by reverse imaging on a Park Scientific Instrument AFM using a conventional sharp tip [see Fig. 1(a)]. Before addressing viscoelastic properties, we determine the accuracy of our new geometry in the spherical Hertz model. A cross-linked 4% polyacrylamide gel (300 mm thick, 30兾0.8 acrylamide兾bisacrylamide by weight and where bisacrylamide is the cross-linker) provided the test sample. The cross-linking provides an elastic response. Substrate effects observed in thinner samples can be ruled out because the film is relatively thick 共.200 mm兲p[11]. The Hertz model predicts a constant value for F兾 Rd3 (R: radius of the bead; F: applied force; d: indentation) as a function of the relative indentation d兾R in analogy with the spring constant of Hooke’s law in one dimension [8]. This constant is expressed in terms of the Young’s modulus 共E兲 and the Poisson ratio 共n兲, which quantifies the relation between pshear and compression stretching 3 modes. Plotting 4 F兾 Rd 3 苷 E兾共1 2 n 2 兲 as a function of d兾R and examining the data for a constant value provides the Hertz model’s range of reliability as shown in Fig. 1(b). The data points close to the surface strongly reflect uncertainties in the position of contact accounting FIG. 1. (a) Topographic image of the probe shape generated by the polystyrene sphere glued to the cantilever. (b) p The constant E兾共1 2 n 2 兲, which from the Hertz model is F兾 Rd 3 , is plotted for a polyacrylamide film and two NIH3T3 fibroblasts. The AFM error mode images of the two cells are shown as insets with the measurement positions marked. The gray scale represents changes in height. 24 JULY 2000 for the initial variance. Deviations as d兾R approaches 1 are expected due to limitations of the spherical Hertz model which is accurate only at low indentation depths 共d , R兲, although the model is accurate for a paraboloid at arbitrary indentation depths [13]. The small magnitude 共,10%兲 of the deviation at the higher depths indicates that the indentation shape closely resembles a paraboloid. Thus, Fig. 1(b) shows a clear constant with the exception of points very close to the contact point (within 100 nm) and, to a lesser extent, points very deep in the sample 共.0.2R兲. This AFM data led to a Young’s modulus of 2160 6 640 Pa for the polyacrylamide gel, derived from a Hertz model fit to the data with an assumed 0.33 Poisson ratio, as found by Geissler et al. [14,15]. This compares well to results from a commercial rheometer, Rheometrics 8400, of 2100 6 100 Pa at similar frequencies. The complex shear modulus G ⴱ was measured under an oscillating strain using rotating parallel plates. The shear modulus contains a real (elastic) part, the storage modulus G 0 , that is in phase with the applied signal and an imaginary (viscous) part, the loss modulus G 00 , that is 90± out of phase. G is related to the Young’s modulus by E 苷 2共1 1 n兲G for a continuous medium. In addition to the thicker polymer gel data, we studied the Hertz model for NIH3T3 fibroblasts as a typical example of eukaryotic cells. For the two positions on the cells displayed in Fig. 1(b) the zero-frequency limit of E 苷 E兾共1 2 n 2 兲 was calculated to 1.90 6 0.15 kPa 共A兲 and 1.01 6 0.08 kPa 共B兲 using the conventional Hertz model. For the sake of comparison with the later frequency-dependent data, no assumption on the value of n was made [16]. The extended range that the Hertz model applies to is remarkable despite the fact that cells are only 2–4 microns thick and very soft. No significant deviations from a constant were observed for indentations of up to 25% of the total depth. To measure the viscoelastic properties of cells, a small amplitude (5–20 nm) sinusoidal signal modulated the driving signal perpendicular to the sample surface about an initial (dc) indentation point d0 . The small modulation originated from a lock-in and was fed to the scanner through a custom low frequency addition module. The signal response to the cantilever (force constant k 苷 0.02 0.05 calibrated to within 10%) was returned to the lock-in for comparison. Both the phase and amplitude differences between the applied modulation and the cantilever response signal were recorded. The spherical Hertz model is applicable only for dc measurements. We have extended this to permit viscoelastic measurements, by an expansion in the indentation depth e relative to the avd. For small amplitude oscillations d erage (dc) indentation depth d0 a two-term expansion is sufficient. p p 4 3 ⴱ e . fbead 艐 3 R共E 0 d 3兾2 1 2 E d0 d兲 (1) 881 VOLUME 85, NUMBER 4 PHYSICAL REVIEW LETTERS In analogy to the complex shear modulus 共G ⴱ 兲 from conventional rheometry, we defined the frequency-dependent part of the constant ratio E兾共1 2 n 2 兲 苷 2共1 1 n兲兾共1 2 ⴱ n 2 兲G ⴱ as E , and E 0 refers to the zero frequency value of 2共1 1 n兲兾共1 2 n 2 兲G 0 . The first term of Eq. (1) is the spherical Hertz model appropriate for dc measurements, and the second term is the frequency-dependent term of the force fosc . Experimentally, the probe deforms the sample to a point d0 with a small additional oscillating signal and the cantilever responds with a phase-shifted signal. Changes in d0 were made extremely slowly in comparison e so d0 is essentially time indepento the frequency of d, dent. The difference between the oscillating signal driving e has the sample and the resulting signal of the cantilever d ± both a real (in-phase) and an imaginary (90 out-of-phase) component, which are related to the real and imaginary parts of fosc . If no other forces existed in this system, then Eq. (1) and the AFM data would be sufficient to determine ⴱ 0 the value of E with its real (storage) E and imaginary 00 (loss) E components. However, the hydrodynamic impact on the cantilever as it oscillates in the surrounding media affects the total measured response. We expect the drag force fdrag to be proportional to the frequency of oscillation v, the amplie the size of the cantude of the indentation oscillation d, tilever, and the viscosity of the media, grouped into the constant a. e fdrag 苷 iva d (2) Measuring the cantilever response to oscillations in the sample while the cantilever was barely above the surface provided a. The value of fdrag could then be determined e There for any indentation of the sample with variable d. will be no drag on the zero-frequency response so fdrag contributes solely to the value of fosc . The measured frequency-dependent cantilever response ftotal is the sum of fosc and fdrag . Thus, fosc can be extracted. The second term of Eq. (1) can then be rearranged to provide the storⴱ 0 00 age and loss components of E 苷 E 1 iE with complex e values for fosc and d. 1 fosc . (3) e p d0 R 2 d Again the 4% polyacrylamide film serves as a simple e shows standard for the model. Figure 2(a) depicts fosc 兾d as a function of the square root of d0 . The square root dependence on d0 , expected from Eq. (3), is clearly evident in the real part. As this model is only a two-term expansion in d, its accuracy is not maintained for very low d0 where the oscillation amplitude is comparable to d0 . This effect is most evident in the imaginary part of fosc evident as an initial apparent dip. This artifact, broadened by the time resolution of the lock-in amplifier, obscures the square root dependence of the imaginary part of fosc until deeper indentations. ⴱ E 苷 882 24 JULY 2000 FIG. 2. (a) Shown here is the polyacrylamide data at 50 Hz of both the in-phase (real) and 90± out-of-phase (imaginary) e The large initial imaginary component components of fosc 兾d. is a surface artifact broadened by the resolution of the lock-in. 0 00 (b) Frequency scan of E and E for a polyacrylamide film with error bars reflecting uncertainties due to the contact point and the calibration of the cantilever force constant. e the values of E For values of fosc when d0 ¿ d, 00 and E can be determined with Eq. (3). To illustrate the ⴱ 0 00 frequency dependence of E , E and E were plotted on a log scale in Fig. 2(b) with respect to frequency. 00 As was clear in the previous figure, E is very small in e An elastic, rubberlike plateau the range where d0 ¿ d. 0 00 0 共E 艐 const; E ø E 兲 is clearly visible in this frequency range as expected for a cross-linked gel. The plateau 0 modulus of E is approximately 2.3 6 0.2 kPa. The error bars on the graph reflect the uncertainties due to cantilever force constant calibrations and the contact point [17]. NIH3T3 fibroblasts demonstrate the versatility of our AFM-based microrheology for complex biological materials with viscous areas as well as elastic areas varying on a scale of microns. The real and imaginary parts of ⴱ the viscoelastic constant E taken at 50 Hz are plotted in Fig. 3(a) as a function of the total indentation depth d0 . Though the polyacrylamide data were obtained with the smallest radius probe, the linearity of the data extends well into the sample beyond the linearity of the cell data. The cells display a nonlinear increase in the elasticity for high indentation depths, although the indentation is still not a significant percentage of the probe radius. This nonlinearity does not necessarily imply that the cell itself is nonlinear over this low stress range. Unlike the relatively thick polyacrylamide sample, the cells are much thinner (2–4 microns), and thus the effect of the substrate is measurable earlier than deviations from the Hertz model due to indentations on the order of R. For oscillation amplitudes near d0 , all curves show a deviation in analogy to the results of Fig. 2(b). The constant regime begins beyond the 0 VOLUME 85, NUMBER 4 PHYSICAL REVIEW LETTERS initial surface artifact and extends 200–500 nm into the cell, about 10% of the overall depth of the sample as ex0 pected for thin samples [18]. In this range, the slope of E 00 and E is practically zero with the plateau continuing for hundreds of nanometers (80 data points). An average over this region provides the viscoelastic constants of interest, and unlike the polyacrylamide data, the cells show a significant viscous contribution. Data from two typical NIH3T3 fibroblasts are shown in Fig. 3(b) and the real and imaginary parts are very close. Furthermore, the cells show a significant frequency dependence of the viscoelastic constant, which nearly doubles 0 over frequencies ranging from 50–300 Hz. E ranges from close to the zero-frequency results at 2.1 6 0.2 kPa and 1.2 6 0.1 kPa to 3.1 6 0.3 kPa and 2.0 6 0.2 kPa 00 for cells A and B, respectively, and E varies similarly. The fibroblasts’ viscoelastic behavior strongly resembles the transition from the elastic rubberlike plateau to the internal dynamics regime found in this frequency range for actin gels [19], indicating that the response is dominated by the actin cytoskeleton of the cells. The viscoelastic behavior of polymer solutions and gels is directly related to the motions of individual chains in the polymer network. Thus, rheological measurements not only provide viscoelastic constants, but also give detailed information about polymer dynamics. Our AFM-based 0 00 FIG. 3. (a) E and E taken at 50 Hz are plotted for the two positions on the NIH3T3 cells pictured in Fig. 1(b) and a poly00 acrylamide gel as a function of total indentation depth. E is negative as expected for viscous loss. (b) The absolute values 0 00 of the elastic component jE j and the viscous component jE j for the two specific positions of the two cells are plotted with respect to frequency. 24 JULY 2000 technique performs quantitative, frequency-dependent microrheology with a submicron spatial resolution, which is particularly suited for thin, spatially inhomogeneous samples inaccessible through standard rheology. Quantifying the data required us to address previous problems due to the complex, highly nonlinear deformation by standard AFM tips, hydrodynamic contributions of the cantilever, and deviations of the Hertz model in finite thickness samples. As with conventional rheology, our new technique can have a major impact on the understanding of polymeric properties, especially of complex systems such as inhomogeneous thin films, which are of increasing interest to soft condensed matter physics. [1] C. Rotsch, K. Jacobson, and M. Radmacher, Proc. Natl. Acad. Sci. U.S.A. 96, 921 – 926 (1999). [2] M. Radmacher, R. W. Tilmann, and H. E. Gaub, Biophys. J. 64, 735 – 742 (1993); E. Nagao and J. A. Dvorak, Biophys. J. 76, 3289 – 3297 (1999). [3] E. L. Elson, Annu. Rev. Biophys. Chem. 17, 397 – 430 (1988). [4] N. O. Petersen, W. B. McConnaughey, and E. L. Elson, Proc. Natl. Acad. Sci. U.S.A. 79, 5327 – 5331 (1982). [5] S. Yamada, D. Wirtz, and S. Kuo, Biophys. J. 78, 1736 – 1747 (2000). [6] F. Ziemann, J. Rädler, and E. Sackmann, Biophys. J. 66, 2210 – 2216 (1994). [7] N. A. Burnham and R. J. Colton, J. Vac. Sci. Technol. A 7, 2906 – 2913 (1989). [8] L. D. Landau and E. M. Liftshitz, Theory of Elasticity (Pergamon Press, Oxford, 1970), p. 14. [9] E. A-Hassan, W. F. Heinz, M. D. Antonik, N. P. D’Costa, S. Nageswaran, C. Schoenenberger, and J. H. Hoh, Biophys. J. 74, 1564 – 1578 (1998); W. H. Goldmann, R. Galneder, M. Ludwig, W. Xu, E. D. Adamson, N. Wang, and R. M. Ezzel, Exp. Cell Res. 239, 235 – 242 (1998); M. Lekka, P. Laider, D. Gil, J. Lekki, Z. Stachura, and A. Z. Hrynkiewicz, Eur. Biophys. J. 28, 312 – 316 (1999). [10] M. Radmacher, M. Fritz, C. M. Kacher, J. P. Cleveland, and P. K. Hansma, Biophys. J. 70, 556 – 567 (1996). [11] J. Domke and M. Radmacher, Langmuir 14, 3320 – 3325 (1998). [12] The beads were attached using a low viscosity epoxy glue. [13] I. N. Sneddon, Int. J. Eng. Sci. 3, 47 – 57 (1965). [14] E. Geissler and A. M. Hetch, Macromolecules 13, 1276 – 1280 (1980). [15] Differences in elasticity constants probably originate from slight differences in polymer preparation between different samples and from uncertainties in the tip force constant. [16] The Poisson ratio 共n兲 is 0.5 for an incompressible medium but can be less. 00 [17] The large error bars in E are a result of the strong surface artifact and the phase resolution. [18] J. A. Ogilvy, J. Phys. D 26, 2123 – 2131 (1993). [19] J. Böhm, D. Humphrey, D. Saha, F. C. MacKintosh, C. Duggan, and J. Käs, Biophys. J. (to be published). 883
