Precipitable Water Column Retrieval from GOME Data Ahilleas N. Maurellis , R¨
advertisement

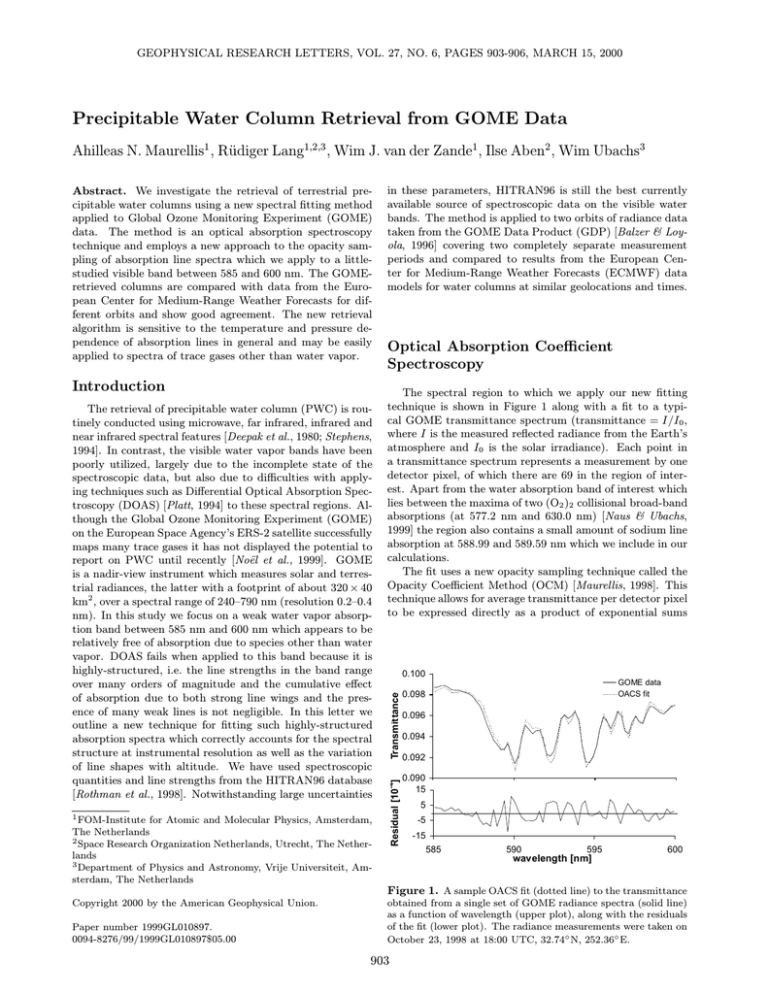
GEOPHYSICAL RESEARCH LETTERS, VOL. 27, NO. 6, PAGES 903-906, MARCH 15, 2000 Precipitable Water Column Retrieval from GOME Data Ahilleas N. Maurellis1 , Rüdiger Lang1,2,3 , Wim J. van der Zande1 , Ilse Aben2 , Wim Ubachs3 The retrieval of precipitable water column (PWC) is routinely conducted using microwave, far infrared, infrared and near infrared spectral features [Deepak et al., 1980; Stephens, 1994]. In contrast, the visible water vapor bands have been poorly utilized, largely due to the incomplete state of the spectroscopic data, but also due to difficulties with applying techniques such as Differential Optical Absorption Spectroscopy (DOAS) [Platt, 1994] to these spectral regions. Although the Global Ozone Monitoring Experiment (GOME) on the European Space Agency’s ERS-2 satellite successfully maps many trace gases it has not displayed the potential to report on PWC until recently [Noël et al., 1999]. GOME is a nadir-view instrument which measures solar and terrestrial radiances, the latter with a footprint of about 320 × 40 km2 , over a spectral range of 240–790 nm (resolution 0.2–0.4 nm). In this study we focus on a weak water vapor absorption band between 585 nm and 600 nm which appears to be relatively free of absorption due to species other than water vapor. DOAS fails when applied to this band because it is highly-structured, i.e. the line strengths in the band range over many orders of magnitude and the cumulative effect of absorption due to both strong line wings and the presence of many weak lines is not negligible. In this letter we outline a new technique for fitting such highly-structured absorption spectra which correctly accounts for the spectral structure at instrumental resolution as well as the variation of line shapes with altitude. We have used spectroscopic quantities and line strengths from the HITRAN96 database [Rothman et al., 1998]. Notwithstanding large uncertainties 1 FOM-Institute for Atomic and Molecular Physics, Amsterdam, The Netherlands 2 Space Research Organization Netherlands, Utrecht, The Netherlands 3 Department of Physics and Astronomy, Vrije Universiteit, Amsterdam, The Netherlands Optical Absorption Coefficient Spectroscopy The spectral region to which we apply our new fitting technique is shown in Figure 1 along with a fit to a typical GOME transmittance spectrum (transmittance = I/I0 , where I is the measured reflected radiance from the Earth’s atmosphere and I0 is the solar irradiance). Each point in a transmittance spectrum represents a measurement by one detector pixel, of which there are 69 in the region of interest. Apart from the water absorption band of interest which lies between the maxima of two (O2 )2 collisional broad-band absorptions (at 577.2 nm and 630.0 nm) [Naus & Ubachs, 1999] the region also contains a small amount of sodium line absorption at 588.99 and 589.59 nm which we include in our calculations. The fit uses a new opacity sampling technique called the Opacity Coefficient Method (OCM) [Maurellis, 1998]. This technique allows for average transmittance per detector pixel to be expressed directly as a product of exponential sums 0.100 Transmittance Introduction in these parameters, HITRAN96 is still the best currently available source of spectroscopic data on the visible water bands. The method is applied to two orbits of radiance data taken from the GOME Data Product (GDP) [Balzer & Loyola, 1996] covering two completely separate measurement periods and compared to results from the European Center for Medium-Range Weather Forecasts (ECMWF) data models for water columns at similar geolocations and times. Residual [10-4] Abstract. We investigate the retrieval of terrestrial precipitable water columns using a new spectral fitting method applied to Global Ozone Monitoring Experiment (GOME) data. The method is an optical absorption spectroscopy technique and employs a new approach to the opacity sampling of absorption line spectra which we apply to a littlestudied visible band between 585 and 600 nm. The GOMEretrieved columns are compared with data from the European Center for Medium-Range Weather Forecasts for different orbits and show good agreement. The new retrieval algorithm is sensitive to the temperature and pressure dependence of absorption lines in general and may be easily applied to spectra of trace gases other than water vapor. GOME data OACS fit 0.098 0.096 0.094 0.092 0.090 15 5 -5 -15 585 590 595 wavelength [nm] 600 Figure 1. A sample OACS fit (dotted line) to the transmittance Copyright 2000 by the American Geophysical Union. Paper number 1999GL010897. 0094-8276/99/1999GL010897$05.00 obtained from a single set of GOME radiance spectra (solid line) as a function of wavelength (upper plot), along with the residuals of the fit (lower plot). The radiance measurements were taken on October 23, 1998 at 18:00 UTC, 32.74◦ N, 252.36◦ E. 903 904 MAURELLIS ET AL.: GOME WATER COLUMN RETRIEVAL 20 a) 18 ECMWF OACS 1-level DOAS -2 14 5 4 -2 12 PWC [g·cm ] PWC [10 · molec·cm ] 16 3 22 10 8 2 6 4 1 2 cloud cover [%] b) 0 100 0 50 0 -40 -20 0 latitude 20 40 60 Figure 2. Comparison of GOME-retrieved precipitable water columns with ECMWF expected values (solid line) for data taken on October 23, 1998 from 17:52–18:32 UTC as a function of latitude covered. The orbit covered longitudes from 235◦ E to 279◦ E. The ECMWF expected values are for the same geolocations at a time of 18:00 UTC. (a) Two methods are compared with ECMWF: a 1-level OACS (filled boxes) corresponding to an altitude range of 0.2-0.4 km and a 1-level DOAS (crosses). The error bars reflect OACS goodness-of-fit. The gap in retrievals at about 55◦ latitude is due to a lack of convergence in OACS 1-level fits (see text). (b) Percentage cloud cover reported by GDP level-2 data. The North American continent lies beneath the data for latitudes greater than approximately 30◦ N; at lower latitudes the orbit covers the Pacific. (`) containing weights αi Z λ2 over cross-section bins ξi , viz. " exp(−τ (z, λ)) dλ ≈ λ1 L X Y `=1 # (`) αi e−ξi N` ∆λ . (1) i Here optical depth τ is assumed to be a function of altitude z and wavelength λ. Although OCM appears to be similar to exponential-sum sampling techniques such as the k-distribution method (cf. [Kato et al., 1999]), the OCM (`) coefficients αi are calculated directly from the number of discretized cross-section counts in a logarithmic crosssection bin ξi rather than via a probability density function. Integration limits λ1 and λ2 represent the effective wavelength bounds of detection of a detector pixel while ∆λ represents the level of wavelength discretization of the absorption spectra. The level index ` runs over L discrete altitude layers each contributing an attenuation proportional to an optical depth ξi N` which is multiplied by the increase in path length due to solar zenith angle appropriate for a spherical atmosphere [Banks & Kockarts, 1973]. Here N` ≡ R z`+1 z` n(z) dz is the vertical column density within a layer bounded P by altitudes [z` , z`+1 ]. The total PWC is given by N = ` N` . Thus OCM samples the opacities due to L absorption spectra, each constructed from 638 Voigt realizations of HITRAN96 line data in the wavelength range of interest. In contrast, a DOAS implementation uses absorption spectra which have been convolved to the instrumental resolution. The result is that OCM is more accurate than DOAS because it correctly samples full line profiles and the degree to which they overlap regardless of the degree of saturation at their line centers, provided that the mean saturation per detector pixel (i.e. at instrumental resolution) is not significant. Numerical tests show that the error in the OCM-calculated transmittance is less than 1% if the mean optical depth per detector pixel is less than 2 × 10⁻¹ . We employ the acronym OACS (for Optical Absorption Coefficient Spectroscopy) for the process of using OCM to fit multiple absorption spectra to GOME transmittances. After discretizing a cross-section realization for a given temperature T and pressure p at a resolution ∆λ = 0.001 cm−1 (corresponding to a wavelength resolution of about 3.5 × 10⁻⁵ nm), an OCM sampling of the cross-section yields cross-section counts αi (T, p). These counts are pre-computed for a wide range of temperatures and pressures and then in(`) terpolated to obtain αi for levels ` appropriate to the atmospheric conditions corresponding to a particular GOME measurement. (We currently use ECMWF atmospheric temperature and pressure profiles although this information may be drawn from other sources during operational retrieval.) Equation (1) is then simultaneously fitted to all points within a GOME transmittance spectrum using a highly robust large-scale trust-region optimization method [Byrd et al., 1988]. The fit parameters are N` and, as in DOAS, the coefficients of a second-order polynomial in wavelength which further takes into account the effects of extinction due to Mie and Rayleigh scattering and the broad band absorption of (O2 )2 . Before every iteration of the fit, the OCM-sampled transmittance is smoothed by a Gaussian model of the GOME detector slit function with a FWHM 905 MAURELLIS ET AL.: GOME WATER COLUMN RETRIEVAL 18 a) 5.0 16 ECMWF OACS 9-level OACS 1-level 4.0 12 -2 PWC [g·cm ] 22 -2 PWC [10 · molec·cm ] 14 3.0 10 8 2.0 6 4 1.0 2 cloud cover [%] b) 0 100 0.0 50 0 -60 -40 -20 0 latitude 20 40 60 Figure 3. Comparison of GOME-retrieved precipitable water columns with ECMWF expected values (solid line)for data taken on February 25, 1997 from 11:26 to 12:01 UTC, as a function of latitude covered. The orbit covered longitudes from 322◦ E to 2◦ E. The ECMWF data corresponds to a time of 12:00 UTC. (a) Two methods are compared with ECMWF: 1-level OACS (empty circles, altitude range of 0.2–0.4 km) and 9-level OACS (filled boxes, altitude range of 0.2–21 km). The error bars apply only to the 9-level OACS retrievals. (b) Percentage cloud cover reported by GDP level-2 data. The orbit covers the North Sea, the Channel and parts of western Europe (above 35◦ N), Africa (10◦ –35◦ N) and the Atlantic (below 10◦ N). value of 0.35 nm [Caspar & Chance, 1997]. The parameter L is constrained only by available computing resources and the desired accuracy of the fit which means that OACS also has the potential to yield density profile information. Discussion of Results We now compare ECMWF model predictions with OACS retrievals for the first of two roughly longitudinal orbits of GOME transmittance spectra. The ECMWF data is chosen to be as close in time as possible to the GOME orbit and is interpolated across the GOME footprint for each transmittance spectrum. Figure 2 shows PWC retrieved from 1-level OACS fits (i.e. L = 1 in equation 1) as well as 1-level DOAS fits, both presented as a function of latitude. The single level is chosen to correspond to temperatures and pressures at altitudes between approximately 0.2 and 0.4 km in the ECMWF background atmosphere since the bulk of water vapor is expected at lower altitudes. The error bars reflect the goodness-of-fit to the observed spectrum (see residuals in Figure 1). We also show the percentage of cloud cover per retrieval, taken directly from GDP level-2 data, although OACS does not use this information to obtain the best fit. In other words, OACS currently makes no adjustments for the presence of clouds. Clearly DOAS significantly underestimates the columns predicted by ECMWF. This holds true even when more than one temperature- and pressuredependent realization of the absorption spectrum is used simultaneously. As discussed earlier, this is because DOAS uses a wavelength average of the absorption strengths rather than wavelength-averaging the transmittances. Thus absorption is over-estimated and PWC is subsequently underestimated. OACS reproduces ECMWF values well except in cases where the mean fitted optical depth per detector pixel is greater than 2 × 10⁻¹ . Such optical depths may be due either to significant cloud cover or to water column densities greater than about 1.5 × 10²³ molec cm−2 . Apart from this, agreement is particularly good over regions where ECMWF has denser measurements (for example, due to ground-based radiosonde data at latitudes greater than approximately 30◦ N) but poorer for regions where ECMWF relies mostly on TOVS remote sensing data [Chaboureau et al., 1998]. Figure 3 shows PWC obtained for both a 1-level and a 9-level OACS retrieval (i.e. L = 1, L = 9 in equation 1) applied to a second GOME orbit. In the 9-level case, the levels are chosen to represent temperatures and pressures between about 0.2 and 21 km in the ECMWF background atmospheric model. The 9-level OACS retrievals show better agreement than the 1-level OACS retrievals and are less sensitive to cloud cover. Furthermore, the 1-level OACS fails to converge in about 6% of all attempted retrievals, compared to less than 1% for a 9-level OACS. The existence of discrepancies between our results and ECMWF data (confirmed by a preliminary comparison with Special Sensor Microwave/Image data) in instances of significant optical depth and due either to clouds or mild saturation effects suggests that more accurate spectroscopic data are required in order to improve OACS retrievals of PWC. 906 MAURELLIS ET AL.: GOME WATER COLUMN RETRIEVAL In summary, we have demonstrated the first application of OACS, a new column retrieval technique, to PWC retrieval from GOME data. The only operational inputs required for OACS are background atmospheric temperature and pressure profiles, i.e. no a priori knowledge of the trace gas profile is included in the calculation (cf. [Noël et al., 1999] in which a priori water vapor profiles were used). New high-resolution measurements of water vapor in the visible [Lang et al., 1999; Carleer et al., 1999] are expected to modify line parameters within the existing HITRAN96 database as well as add a significant number of new lines. Since OACS is very sensitive to the details of the line structure within an absorption spectrum, the new spectra will contribute greatly to the accuracy of the method which already appears to offer a significant alternative to other methods of water column retrieval. Acknowledgments. We are grateful to H. Naus (VU) and D.M. Stam (SRON) for useful discussions and M. van den Broek (SRON/IMAU) and P.F.J. van Velthoven (KNMI) for assistance with ECMWF data. ESA is acknowledged for providing GOME data (ESA 1995-1999) processed by DFD/DLR. This work is part of the research program of the Foundation of Fundamental Research on Matter (FOM) and is supported by SRON through project grants EO-023 and EO-0123. ANM acknowledges support from Marie Curie Environment & Climate grant ERB4001GT980174. References Banks, P. M. and G. Kockarts, Aeronomy, Part B, 107 pp., Academic Press, London, U.K., 1973. Balzer, W. and D. Loyola, Product Specification Document of the GOME Data Processor, Technical Document ER-PS-DLR-600016, Deutsche Forschungsanstalt für Luft- und Raumfahrt, 21 pp., 1996. Byrd, R. H., R. B. Schnabel and G. A. Shultz, Approximate Solution of the Trust Region Problem by Minimization over Two-Dimensional Subspaces, Mathematical Programming, 40, 247-263, 1988. Carleer, M., A. Jenouvrier, A.-C. Vandaele, P. F. Bernath, M. F. Mérienno, R. Colin, N. F. Zobov, O. L. Polyansky, J. Tennyson, V. A. Savin, The Near Infrared, Visible and Near Ultraviolet Overtone Spectrum of Water, J. Chem. Phys., in press, 1999. Caspar, C. and K. Chance, GOME Wavelength Calibration Using Solar and Atmospheric Spectra, Proc. 3rd ERS Symposium at Florence, Italy, Mar. 17 to 21, ESA SP-414, 1997. Chaboureau, J.-P., A. Chédin and N. Scott, Remote Sensing of the Vertical Distribution of Atmospheric Water Vapor from the TOVS observations: Method and Validation, J. Geophys. Res., 103, 8743-8752, 1998. Deepak, A., T. D. Wilkerson and L. H. Runke (Eds.), Atmospheric Water Vapor, 1 pp., Academic Press, New York, 1980. Kato, S., T. P. Ackerman, J. H. Mather and E. E. Clothiaux, The k-distribution Method and Correlated-k Approximation for a Shortwave Radiative Transfer Model, J. Quant. Spect. & Rad. Transfer, 62, 109-121, 1999. Lang, R., A. N. Maurellis, W. J. van der Zande, I. Aben, P. Levelt, H. Naus, and W. Ubachs, DOAS-OCM Retrieval of Water Vapor from GOME and New CRD Spectroscopy, Proc. ESA Symposium on Measurements from Space, 1, 391-394, 1999. Maurellis, A. N., Non-Auroral Models of the Jovian Ionosphere, Ph.D. thesis, 75 pp., University of Kansas, June 1998. Naus, H and W. Ubachs, Visible Absorption Bands of the (O2 )2 Collision Complex at Pressures below 760 Torr, Applied Optics, 38, 3423-3428, 1999. Noël, S., M. Buchwitz, H. Bovensmann, R. Hoogen and J. P. Burrows, Atmospheric Water Vapor Amounts Retrieved from GOME Satellite Data, Geophys. Res. Lett., 26, 1841-1844, 1999. Platt, U., Differential Absorption Spectroscopy (DOAS), Air Monitoring by Spectroscopic Techniques, M. W. Sigvist (Ed.), pp. 27-84, Wiley, New York, 1994. Rothman, L. S. et al., The HITRAN Molecular Spectroscopic Database and HAWKS (HITRAN Atmospheric Workstation) 1996 Edition, J. Quant. Spectros. Radiat. Transfer, 60, 665710, 1998. Stephens, G. L., Remote Sensing of the Lower Atmosphere, 343 pp., Oxford Univ. Press, Oxford, U.K., 1994. A. N. Maurellis, R. Lang, W. J. van der Zande, FOMInstitute AMOLF, Kruislaan 407, 1098 SJ Amsterdam, The Netherlands, (e-mail: A.Maurellis@amolf.nl; R.Lang@ amolf.nl; W.v.d.Zande@amolf.nl) I. Aben, SRON, Sorbonnelaan 2, 3584 CA Utrecht, The Netherlands (email: i.aben@sron.nl) W. Ubachs, VU, Department of Physics & Astronomy, De Boelelaan 1081, 1081 HV Amsterdam, The Netherlands (email: wimu@nat.vu.nl) (Received July 2, 1999; revised August 21, 1999; accepted November 4, 1999.)


