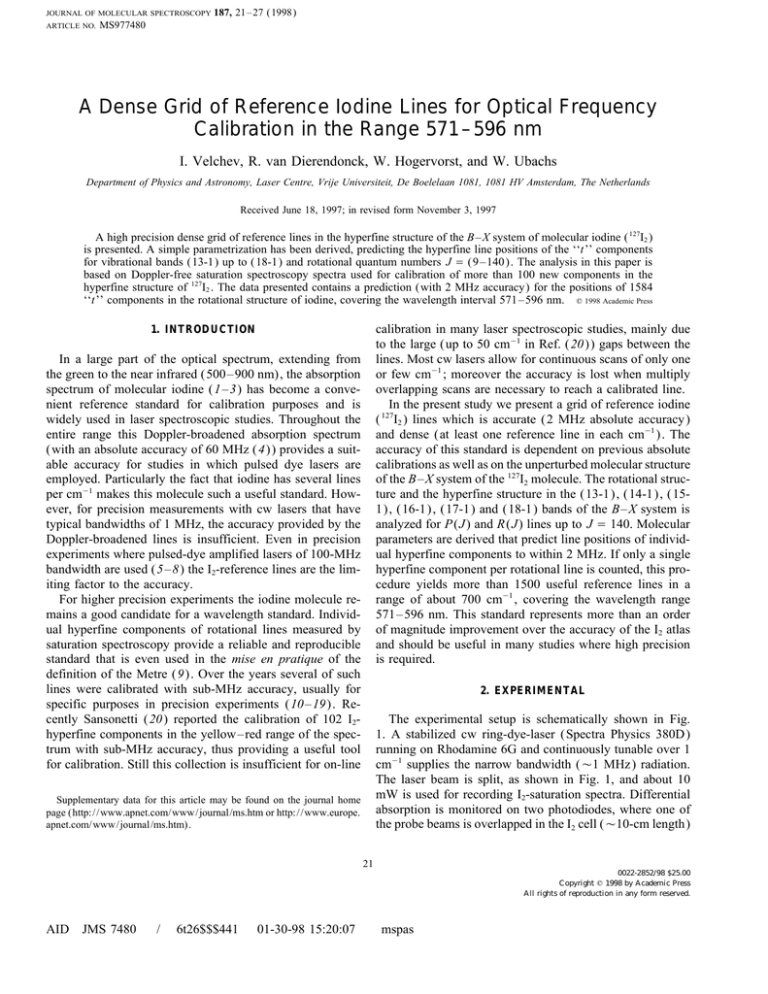
A Dense Grid of Reference Iodine Lines for Optical Frequency
advertisement

JOURNAL OF MOLECULAR SPECTROSCOPY
ARTICLE NO.
187, 21–27 (1998)
MS977480
A Dense Grid of Reference Iodine Lines for Optical Frequency
Calibration in the Range 571–596 nm
I. Velchev, R. van Dierendonck, W. Hogervorst, and W. Ubachs
Department of Physics and Astronomy, Laser Centre, Vrije Universiteit, De Boelelaan 1081, 1081 HV Amsterdam, The Netherlands
Received June 18, 1997; in revised form November 3, 1997
A high precision dense grid of reference lines in the hyperfine structure of the B–X system of molecular iodine ( 127I2 )
is presented. A simple parametrization has been derived, predicting the hyperfine line positions of the ‘‘t’’ components
for vibrational bands (13-1) up to (18-1) and rotational quantum numbers J Å (9–140). The analysis in this paper is
based on Doppler-free saturation spectroscopy spectra used for calibration of more than 100 new components in the
hyperfine structure of 127I2 . The data presented contains a prediction (with 2 MHz accuracy) for the positions of 1584
‘‘t’’ components in the rotational structure of iodine, covering the wavelength interval 571–596 nm. q 1998 Academic Press
calibration in many laser spectroscopic studies, mainly due
to the large (up to 50 cm01 in Ref. (20)) gaps between the
lines. Most cw lasers allow for continuous scans of only one
or few cm01 ; moreover the accuracy is lost when multiply
overlapping scans are necessary to reach a calibrated line.
In the present study we present a grid of reference iodine
( 127I2 ) lines which is accurate (2 MHz absolute accuracy)
and dense (at least one reference line in each cm01 ). The
accuracy of this standard is dependent on previous absolute
calibrations as well as on the unperturbed molecular structure
of the B–X system of the 127I2 molecule. The rotational structure and the hyperfine structure in the (13-1), (14-1), (151), (16-1), (17-1) and (18-1) bands of the B–X system is
analyzed for P(J) and R(J) lines up to J Å 140. Molecular
parameters are derived that predict line positions of individual hyperfine components to within 2 MHz. If only a single
hyperfine component per rotational line is counted, this procedure yields more than 1500 useful reference lines in a
range of about 700 cm01 , covering the wavelength range
571–596 nm. This standard represents more than an order
of magnitude improvement over the accuracy of the I2 atlas
and should be useful in many studies where high precision
is required.
1. INTRODUCTION
In a large part of the optical spectrum, extending from
the green to the near infrared (500–900 nm), the absorption
spectrum of molecular iodine (1–3) has become a convenient reference standard for calibration purposes and is
widely used in laser spectroscopic studies. Throughout the
entire range this Doppler-broadened absorption spectrum
(with an absolute accuracy of 60 MHz (4)) provides a suitable accuracy for studies in which pulsed dye lasers are
employed. Particularly the fact that iodine has several lines
per cm01 makes this molecule such a useful standard. However, for precision measurements with cw lasers that have
typical bandwidths of 1 MHz, the accuracy provided by the
Doppler-broadened lines is insufficient. Even in precision
experiments where pulsed-dye amplified lasers of 100-MHz
bandwidth are used (5–8) the I2-reference lines are the limiting factor to the accuracy.
For higher precision experiments the iodine molecule remains a good candidate for a wavelength standard. Individual hyperfine components of rotational lines measured by
saturation spectroscopy provide a reliable and reproducible
standard that is even used in the mise en pratique of the
definition of the Metre (9). Over the years several of such
lines were calibrated with sub-MHz accuracy, usually for
specific purposes in precision experiments (10–19). Recently Sansonetti (20) reported the calibration of 102 I2hyperfine components in the yellow–red range of the spectrum with sub-MHz accuracy, thus providing a useful tool
for calibration. Still this collection is insufficient for on-line
2. EXPERIMENTAL
The experimental setup is schematically shown in Fig.
1. A stabilized cw ring-dye-laser (Spectra Physics 380D)
running on Rhodamine 6G and continuously tunable over 1
cm01 supplies the narrow bandwidth ( Ç1 MHz) radiation.
The laser beam is split, as shown in Fig. 1, and about 10
mW is used for recording I2-saturation spectra. Differential
absorption is monitored on two photodiodes, where one of
the probe beams is overlapped in the I2 cell ( Ç10-cm length)
Supplementary data for this article may be found on the journal home
page (http://www.apnet.com/www/journal/ms.htm or http://www.europe.
apnet.com/www/journal/ms.htm).
21
0022-2852/98 $25.00
Copyright q 1998 by Academic Press
All rights of reproduction in any form reserved.
AID
JMS 7480
/
6t26$$$441
01-30-98 15:20:07
mspas
22
VELCHEV ET AL.
FIG. 1. Scheme of the experimental setup.
with a mechanically chopped (800 Hz) saturating beam. The
differential signal is electronically filtered and stored in a
computer. The sealed I2 cell is used at room temperature
vapor pressure. From the kHz-precision studies of Bordé et
al. (21) we conclude that at our measuring conditions aiming
at an accuracy of 2 MHz no pressure-induced or intensityinduced effects play a role.
Apart from the purpose of a coarse tuning needed to identify the resonances, no absolute wavelength measurements
were performed in our experiment. The concept of the present method involves only relative frequency measurements
with a stabilized (75-cm length) etalon with respect to calibrated absolute frequency points derived from the literature
(18, 20). The étalon is pressure and temperature stabilized
and further actively locked to the output of a HeNe-laser
(Fig. 1). A 3He 22Ne laser is actively locked to the B component of 129I2 following the procedures of Schweitzer et al.
(22). Before each measurement session the free spectral
range (FSR) of the étalon is determined, resulting in a value
of (148.9560 { 0.0005) MHz, with small day-to-day variations. For this purpose accurately calibrated I2 lines (13, 18,
20) were used. It is essential for a derivation of absolute
frequencies that both the HeNe-laser and the étalon are kept
in lock during an entire measurement session.
Subsequently computer-controlled scans of I2 lines were
recorded in saturated absorption with simultaneous detection
of marker fringes of the étalon. In some cases overlapping
scans were used to record the desired spectral line. After
linearization of the scan by fitting a spline function through
the marker positions, the relative position (between two
markers) of a fixed component of each I2 line is determined
by means of a computerized fitting and interpolation proce-
dure. In this way well-calibrated hyperfine components
(‘‘reference’’ lines) and new lines were recorded. While
the integer number of fringes separating these lines from
reference lines is determined with the aid of the I2 atlas the
fractional values (to within 1% of FSR) give an improved
calibration. Only when the separation exceeds several cm01
does the error in the FSR contribute to the final uncertainty.
In two cases long overlapping scans of 10 cm01 were performed with the goal of calibrating an I2 component close
to a frequency of special interest. First, the frequency of a
component at 1/10 of the 1 1 S–2 1 P resonance line of helium
(6, 7) was recorded in overlapping scans starting at the
R99‘‘i’’(15-1) line accurately calibrated by Grieser et al.
(18). Second, the I2 component R100‘‘t’’(14-0) at 1/6 the
frequency of the Q branch of the L–X (0, 0) band of CO
(8) was recorded with respect to the P98‘‘t’’(14-0) line
provided by Sansonetti (20). Data from these procedures
are included in the present analysis.
An example is shown in Fig. 2 displaying a single scan
over two rotational lines, R17 of ( 16-1) band and one of
the reference lines P12 (16-1 ) , measured by Sansonetti
( 20) with accuracy of 1 MHz ( the ‘‘t ’’ components are
denoted by * ) . The scan axis is calibrated to the reference
line using the FSR of the etalon. In this way the absolute
frequency of R17‘‘t ’’ ( 16-1 ) is determined with an accuracy
of about 2 MHz.
Through frequency separation measurements hyperfine
components of selected P ( J ) and R ( J ) lines in the ( 13-1 )
to ( 18-1 ) bands were recorded and calibrated ( Table 1 ) .
The estimated absolute accuracy varies in the range 1 – 5
MHz. Except for the two wavelength ranges mentioned
above lines were always recorded close to calibrated lines
Copyright q 1998 by Academic Press
AID
JMS 7480
/
6t26$$$442
01-30-98 15:20:07
mspas
REFERENCE LINES FOR OPTICAL FREQUENCY CALIBRATION
23
FIG. 2. Simultaneous scan over two lines (R17 and P12) in the B–X (16-1) band of I2 (lower trace) and the fringes of a stabilized etalon (upper
trace). The ‘‘t’’ components are denoted by *. Note that for the R17 line all 21 transitions corresponding to DF Å DJ Å /1 are resolved.
presented in literature ( 11, 13, 18, 20 ) . In all cases the parameters derived in (1) give an accurate description of
‘‘t ’’ component was selected for calibration. For conve- transition frequencies up to J Ç 160 within the stated uncernience and to avoid any confusion, two typical hyperfine tainty of 60 MHz. The representation of Eqs. [1] and [2]
spectral structures, for odd and even J , are displayed in Fig. will be used in the present study to denote the ‘‘center of
3 with the identification of hyperfine components ( ‘‘a ’’ – gravity,’’ i.e., the energy level structure and transition fre‘‘u ’’ ) adopted from Sansonetti (20 ) . For low J ( J õ 20 ) quencies with all hyperfine effects set to zero.
these typical shapes of the rotational lines undergo changes
The hyperfine structure of I2 has been studied previously
and more hyperfine components become resolved ( see Fig. for a large number of individual rotational lines scattered in
2, where all 21 hyperfine components of R17 ( 16-1 ) can the visible wavelength range. For the purpose of our analysis
be seen ) .
only the two most important terms in the hyperfine Hamiltonian (23) are included:
3. DATA ANALYSIS
In the analysis of their spectra Gerstenkorn and Luc (1)
performed a fit to the rovibronic structure of the B–X system
of I2 with energy representations
EXn Å En0 / Bn0 J(J / 1) 0 Dn0 J 2 (J / 1) 2
/ Hn0 J 3 (J / 1) 3 ,
[1]
EBn Å En= / Bn= J(J / 1) 0 Dn= J 2 (J / 1) 2
/ Hn= J 3 (J / 1) 3 / Ln= J 4 (J / 1) 4
/ Mn= J 5 (J / 1) 5
[2]
for ground and excited states, respectively. The molecular
Hhf Å eQqrHEQ / CrHSR ,
where eQqrHEQ is the electric quadrupole term and CrHSR
is the spin-rotation term ( eQq and C are the conventional
symbols representing the constants for the respective interactions ). These terms are sufficient to represent the separations of F Å J hyperfine components with respect to the
center-of-gravity at the 0.2 MHz level if D J Å {2 contributions are included in the diagonalization of the hyperfine
matrix. Following the discussion of Bordé et al. (21) we
adopt for the X 1S g/ , n9 Å 1 ground state the hyperfine
constants eQq 9 Å 02452.6 MHz and C 9 Å 3 kHz. For the
excited vibrational levels the hyperfine constants (eQq and
Copyright q 1998 by Academic Press
AID
JMS 7480
/
6t26$$$442
01-30-98 15:20:07
[3]
mspas
24
VELCHEV ET AL.
TABLE 1
Measured Frequencies in This Study
Note. The second column gives the values for the ‘‘t’’ component along with the estimated
accuracy of the measurement.
Copyright q 1998 by Academic Press
AID
JMS 7480
/
6t26$$7480
01-30-98 15:20:07
mspas
REFERENCE LINES FOR OPTICAL FREQUENCY CALIBRATION
25
our level of accuracy, one of them, the ‘‘t’’ component, is
preferably used in this study.
For all lines calibrated in the present study the centre of
gravity of the rotational structure was determined by correcting the measured hyperfine components (Table 1) for the
calculated hyperfine shift. All ‘‘t’’ components are redshifted by approximately 483 MHz with slight variations
over the six bands measured and over the rotational lines.
The accurately calibrated lines cited in the literature (9, 11,
18, 20) were included in the analysis but not presented in
Table 1. For each line an estimated uncertainty is listed
as well, which depends on the measurement error and the
uncertainty of the reference line used. For the collection of
lines taken from Sansonetti the resulting uncertainty is less
than 1.0 MHz, including a contribution of the hyperfine
shift correction. For a number of previously reported lines
calibrated by our group (7, 8) (not listed here), the accuracy
varies from 3.0 to 5.0 MHz. The lines specifically calibrated
for the present paper have an accuracy of 1.5–4.5 MHz
depending on the measuring conditions.
For each band all available data on the center-of-gravity
transition frequencies (calculated from Table 1 and from
Refs. (7, 8, 18, 20)) were included in a weighted least
squares fit to obtain a parametrization over the rotational
structure in B–X ( n* 0 1) bands ( n* Å 13–18). It turned
out to be sufficient to vary only the band origin E0 Å En= 0
E1 , the rotational constant B1 , and the rotational constants
Bn= , Dn= , and Hn= of the excited state to find convergence
with a resulting x 2 of less than 1.0 per data point. The higher
order molecular constants for the ground state ( n9 Å 1) were
kept fixed at the values of Gerstenkorn and Luc (1): D1 Å
FIG. 3. Typical pattern of hyperfine structures in I2 . The upper trace
is a recording of the R69(16-1) line and shows the typical structure for an
odd-J line with 21 DF Å DJ main transitions. The lower trace shows the
R98(16-1) line with the typical 15 DF Å DJ main transitions in an evenJ line. In the present study we have adopted the identification of ‘‘a’’–
‘‘u’’ components of Sansonetti (20).
C ) have been reported for n* Å 15 ( 24) and n* Å 17 (25)
only. In this work we adopted the hyperfine constants eQqn=
and Cn= ( n* Å 13 –18) using the empirical formulae given
by Razet and Picard ( 26 ), including the J dependence in
Cn 0. The uncertainty in the eQqn= is estimated at 0.3 MHz,
which yields an uncertainty of less than 0.1 MHz in the
position of the ‘‘t’’ component with respect to the centerof-gravity. Since the spin-rotation contribution to the eigenvalues for F Å J hyperfine components can be neglected at
FIG. 4. The offset of the center-of-gravity frequencies, measured in the
(18-1) band (the data points) from the fitted values (dashed line).
Copyright q 1998 by Academic Press
AID
JMS 7480
/
6t26$$$442
01-30-98 15:20:07
mspas
26
VELCHEV ET AL.
TABLE 2
The Derived Values for the Constants Appearing in Eqs. [1] and [2], Corresponding to ( n* 0 1) Transitions
Note. n* Å (13–18). All the values are in wavenumbers.
4.5722085 1 10 09 cm01 and H1 Å 05.3403223 1 10 016
cm01 . The higher order centrifugal distortion coefficients for
the exited states (Ln= and Mn= ) were also kept fixed at the
values of Ref. (1). Since the goal of the present study is to
find a parametrization of the energy levels only rather than
deriving new details on the molecular structure, no further
attempts in this latter direction were made. The resulting
parameters for the transitions with upper level n* Å (13–
18) (see Table 2) were inserted in Eqs. [1] and [2] for
calculation of the center-of-gravity frequencies.
The consistency of the fits is such that for all bands the
resulting x 2 is much lower than the number of data points.
In all cases five parameters (described above) were optimized in the fitting routines. From the resulting x 2 values we
estimate that the final uncertainties of all center-of-gravity
rotational frequencies are accurate within 2 MHz. This can
be seen from Fig. 4, where the offsets of the calibrated
lines in (18-1) band from the fit are presented. Most of the
measured values lay in the interval ( 02, /2) MHz and the
fit passes through all error margins. Consequently, the fit
for the center-of-gravity frequencies can be used to predict
the positions of the ‘‘t’’ hyperfine components for all lines
with 2 MHz accuracy. This procedure will be discussed in
Section 4.
An important assumption for the validity of the present
procedure is the unperturbed nature of the B–X system of
I2 . The excited B state is known to be perturbed by a repulsive state of 1P1u symmetry, causing predissociation in the
B-state (27). This holds for the region n* Å (13–18) in the
B state. At much higher n states also other states interact
and even u–g symmetry breaking has been observed (21,
27). The coupling with the 1P1u state may in principle cause
energy shifts to the B-state energy levels. However, the coupling to the repulsive state gives rise only to global effects,
slowly varying over the J-quantum number, while no local
effects such as accidental shifts are expected. Indeed such
phenomena were not observed, while care was taken that
P(J) and R(J) transitions were included in the fit in a wide
range of J values with gaps as small as possible. Possible
perturbative effects by the 1P1u state are therefore included
in the present parametrization of the B state energy levels
by the effective molecular parameters as derived in the fits
(Table 2).
4. THE REFERENCE STANDARD
The molecular parameters derived from the present measurements and fitting procedures give a representation of
center-of-gravity transition frequencies of R(J) and P(J)
lines in the (13-1) to (18-1) bands for J up to 140 at an
accuracy level of 2 MHz (Table 2). By invoking the theoretically known hyperfine structure, the frequency of the ‘‘t’’
component of each line can be calculated at the same accuracy level. A list of these calculated transition frequencies
of ‘‘t’’ components is given in supplementary data, corresponding to R and P branches, respectively. The tables start
at J Å 9 because of the strong mutual overlapping of the
rotational lines with lower J, which makes them unsuited
for spectroscopic calibration. These frequencies form a secondary reference standard in the range 571–596 nm. It is a
factor of 30 more accurate than the Doppler-broadened I2reference standard (1). Since a calibrated component is
found in nearly all intervals of 1 cm01 , this dense grid of
reference lines should become a useful tool in laser spectroscopic studies.
5. CONCLUSIONS
In this paper we have shown that a simple parametrization
(involving five molecular parameters) of the positions of
Copyright q 1998 by Academic Press
AID
JMS 7480
/
6t26$$$442
01-30-98 15:20:07
mspas
REFERENCE LINES FOR OPTICAL FREQUENCY CALIBRATION
the ‘‘t’’ hyperfine components in the rotational structure of
127
I2 is possible giving an accuracy of 2 MHz, suitable for
precise spectroscopic measurements. Using this procedure
we present a table, containing 1584 accurate wavenumbers
(see supplementary data), that predicts the line-positions of
the ‘‘t’’ components in the B–X system of 127I2 for vibrational bands (13-1) up to (18-1) and rotational quantum
numbers J from 9 up to 140 (both for R and P branches).
This dense grid of high precision data ( dn / n É 4 1 10 09 )
covers the wavelength range 571–596 nm, corresponding to
a frequency span of 715 cm01 . In a wavelength range near
790 nm a similar reference standard based on I2 hyperfine
components is being developed by Knöckel et al. (28).
ACKNOWLEDGMENTS
The authors would like to thank Dr. C. Sansonetti (NIST) for providing
results on absolute calibrations prior to publication and for stimulating
discussions. They acknowledge Dr. K. A. H. van Leeuwen (Eindhoven) for
the construction of the stabilized HeNe-laser during his Ph.D. thesis work
in our laboratory. Dr. S. Picard (BIPM) has been very helpful by sending
us publications on hyperfine structure calculations. The Netherlands’ Foundation for Fundamental Research on Matter (FOM) is acknowledged for
financial support.
REFERENCES
1. S. Gerstenkorn and P. Luc, ‘‘Atlas du spectre d’absorption de la molecule de l’iode entre 14,800–20,000 cm01 ,’’ Ed. CNRS, Paris; we use
the 1985 version with the ‘‘Complément’’ containing line identifications and details on the rotational analysis.
2. S. Gerstenkorn and P. Luc, ‘‘Atlas du spectre d’absorption de la molecule de l’iode entre 14,000–15,600 cm01 ,’’ Ed. CNRS, Paris, 1978.
3. S. Gerstenkorn, J. Verges, and J. Chevillard, ‘‘Atlas du spectre d’absorption de la molecule de l’iode entre 11,000–14,000 cm01 ,’’ Ed.
CNRS, Paris, 1982.
4. S. Gerstenkorn and P. Luc, Rev. Phys. Appl. 14, 791–794 (1979).
5. J. M. Gilligan and E. E. Eyler, Phys. Rev. A46, 3676–3690 (1992).
6. K. S. E. Eikema, W. Ubachs, W. Vassen, and W. Hogervorst, Phys.
Rev. Lett. 76, 1216–1219 (1996).
7. K. S. E. Eikema, W. Ubachs, W. Vassen, and W. Hogervorst, Phys.
Rev. A55, 1866–1884 (1997).
8. W. Ubachs, K. S. E. Eikema, W. Hogervorst, and P. C. Cacciani, J.
Opt. Soc. Am. B14, 2469–2476 (1997).
9. T. J. Quinn, Metrologia 30, 523–541 (1993).
10. J. E. M. Goldsmith, E. W. Weber, F. V. Kowalski, and A. L. Schawlow,
Appl. Opt. 18, 1983–1987 (1979).
11. P. Juncar, J. Pinard, J. Hamon, and A. Chartier, Metrologia 17, 77–
79 (1981).
12. D. A. Jennings, C. R. Pollock, F. R. Petersen, R. E. Drullinger, K. M.
Evenson, J. S. Wells, J. L. Hall, and H. P. Layer, Opt. Lett. 8, 136–
138 (1983); C. R. Pollock, D. A. Jennings, F. R. Petersen, J. S. Wells,
R. E. Drullinger, E. C. Beaty, and K. M. Evenson, Opt. Lett. 8, 133–
135 (1983).
13. L. Hlousek and W. H. Fairbank, Opt. Lett. 8, 322–323 (1983).
14. P. Juncar, H. G. Berry, R. Damaschini, and H. T. Duong, J. Phys. B16,
381–388 (1983).
15. D. Shiner, J. M. Gilligan, B. M. Cook, and W. Lichten, Phys. Rev. A47,
4042–4045 (1993).
16. O. Acef, J. J. Zondy, M. Abed, D. J. Rovera, A. H. Gerard, A. Clairon,
Ph. Laurent, Y. Millerioux, and P. Juncar, Opt. Comm. 97, 29–34
(1993).
17. U. Brand, Opt. Comm. 100, 361–373 (1993).
18. R. Grieser, G. Bönsch, S. Dickopf, G. Huber, R. Klein, P. Merz, A.
Nicolaus, and H. Schnatz, Z. Phys. A348, 147–150 (1994).
19. C. S. Edwards, G. P. Barwood, P. Gill, F. RodrıB guez-Llorente, and
W. R. C. Rowley, Opt. Comm. 132, 94–100 (1996).
20. C. J. Sansonetti, J. Opt. Soc. Am. B14, 1913–1920 (1997).
21. Ch. J. Bordé, G. Camy, B. Decomps, J. P. Descoubes, and J. Vigué,
J. Physique 42, 1393–1411 (1981).
22. W. G. Schweitzer, E. G. Kessler, R. D. Deslattes, H. P. Layer, and J. R.
Whetstone, Appl. Opt. 12, 2927–2938 (1973).
23. G. R. Hanes, J. Lapierre, P. R. Bunker, and K. C. Shotton, J. Mol.
Spectrosc. 39, 506–515 (1971).
24. A. Razet, Y. Millerioux, and P. Juncar, Metrologia 28, 309–316
(1991).
25. A. Razet, Metrologia 30, 193–195 (1993).
26. A. Razet and S. Picard, Metrologia 34, 181–186 (1997).
27. J. Vigué, M. Broyer, and J. C. Lehmann, J. Physique 42, 937–948,
949–960, 961–978 (1981).
28. H. Knöckel, S. Kremser, B. Bodermann, and E. Tiemann, Z. Phys.
D37, 43–48 (1996).
Copyright q 1998 by Academic Press
AID
JMS 7480
/
6t26$$$443
01-30-98 15:20:07
27
mspas


