Hi F.4 Earth Science 6.0 Activity (Pages 208-221)
advertisement
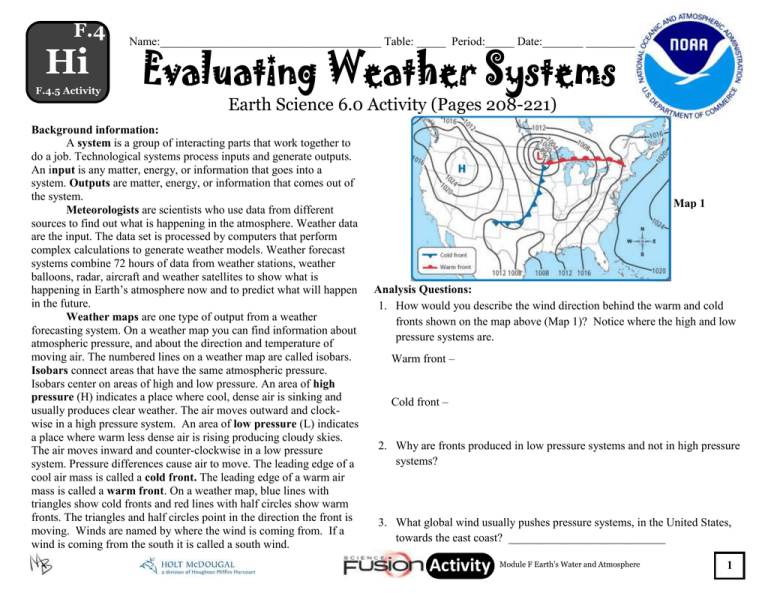
F.4 Hi F.4.5 Activity Name:______________________________________ Table: _____ Period:_____ Date:_______ _________ Earth Science 6.0 Activity (Pages 208-221) Background information: A system is a group of interacting parts that work together to do a job. Technological systems process inputs and generate outputs. An input is any matter, energy, or information that goes into a system. Outputs are matter, energy, or information that comes out of the system. Meteorologists are scientists who use data from different sources to find out what is happening in the atmosphere. Weather data are the input. The data set is processed by computers that perform complex calculations to generate weather models. Weather forecast systems combine 72 hours of data from weather stations, weather balloons, radar, aircraft and weather satellites to show what is happening in Earth’s atmosphere now and to predict what will happen in the future. Weather maps are one type of output from a weather forecasting system. On a weather map you can find information about atmospheric pressure, and about the direction and temperature of moving air. The numbered lines on a weather map are called isobars. Isobars connect areas that have the same atmospheric pressure. Isobars center on areas of high and low pressure. An area of high pressure (H) indicates a place where cool, dense air is sinking and usually produces clear weather. The air moves outward and clockwise in a high pressure system. An area of low pressure (L) indicates a place where warm less dense air is rising producing cloudy skies. The air moves inward and counter-clockwise in a low pressure system. Pressure differences cause air to move. The leading edge of a cool air mass is called a cold front. The leading edge of a warm air mass is called a warm front. On a weather map, blue lines with triangles show cold fronts and red lines with half circles show warm fronts. The triangles and half circles point in the direction the front is moving. Winds are named by where the wind is coming from. If a wind is coming from the south it is called a south wind. Map 1 Analysis Questions: 1. How would you describe the wind direction behind the warm and cold fronts shown on the map above (Map 1)? Notice where the high and low pressure systems are. Warm front – Cold front – 2. Why are fronts produced in low pressure systems and not in high pressure systems? 3. What global wind usually pushes pressure systems, in the United States, towards the east coast? ___________________________ Activity Module F Earth’s Water and Atmosphere 1 F.4 Wc F.4.5 Activity Name:______________________________________ Table: _____ Period:_____ Date:_______ _________ Earth Science 6.0 Activity (Pages 208-221) Map 2 Activity Module F Earth’s Water and Atmosphere 2 F.4 Wc Name:______________________________________ Table: _____ Period:_____ Date:_______ _________ F.4.5 Activity Earth Science 6.0 Activity (Pages 208-221) LA City Spokane Denver Houston Atlanta Orlando Raleigh Cleveland New York Station Model Temp ˚C (Convert) Temp. ˚F Dew Point ˚F Air Pressure Sky Condition Wind Speed Wind Direction Temperature Conversions ˚F= 9/5(˚C) +32 ˚C= (˚F-32)(5/9) Air Pressure: 500 or more, add a 9 & a decimal. Ex: 588 = 9588.8mb Less than 500, add a 10 & a decimal, Ex: 091 = 1009.1mb Activity Module F Earth’s Water and Atmosphere 3 F.4 Wc F.4.5 Activity Name:______________________________________ Table: _____ Period:_____ Date:_______ _________ Earth Science 6.0 Activity (Pages 208-221) Map 2 1. Which information in the table will you use to determine where the high and low pressure systems may be located? 4. Imagine you are a meteorologist in Atlanta and this is the current map (Map 2). What temperature change would you predict over the next few hours, and why? Prediction: Why: 2. What outputs from weather stations are included on a weather map? 3. How will you process the information in the table and on the map (Map 2) to make predictions? Describe how you will use the inputs to develop an output. 5. What pressure change would you predict for Denver over the next few days, and why? Pressure change: Why: 4. According to the data in the table, where are the centers of the high and low pressure systems at this time? Mark them, on the map above, using an H or an L. Activity Module F Earth’s Water and Atmosphere 4
