2012-2013 Actual Financial data Totals for Plano ISD (043910)
advertisement
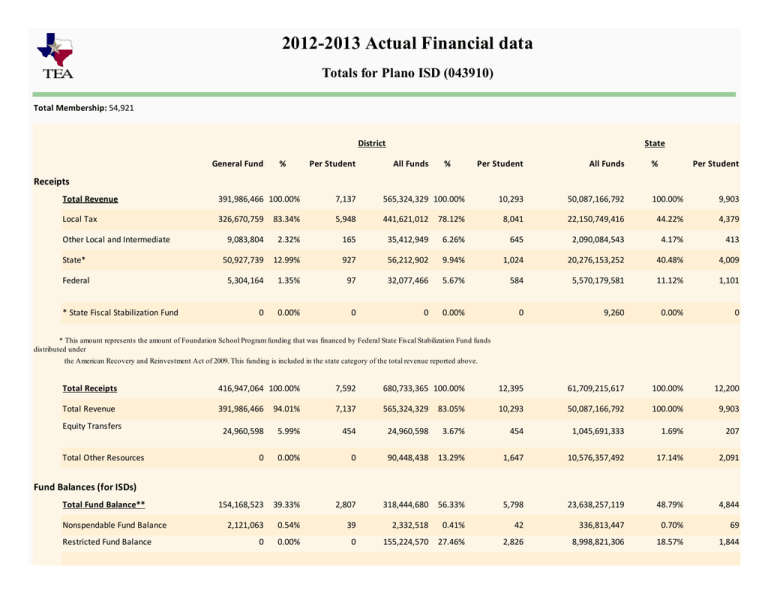
2012-2013 Actual Financial data Totals for Plano ISD (043910) Total Membership: 54,921 District General Fund % Per Student State All Funds % Per Student All Funds % Per Student 10,293 50,087,166,792 100.00% 9,903 Receipts Total Revenue 391,986,466 100.00% 7,137 565,324,329 100.00% Local Tax 326,670,759 83.34% 5,948 441,621,012 78.12% 8,041 22,150,749,416 44.22% 4,379 9,083,804 2.32% 165 35,412,949 6.26% 645 2,090,084,543 4.17% 413 State* 50,927,739 12.99% 927 56,212,902 9.94% 1,024 20,276,153,252 40.48% 4,009 Federal 5,304,164 1.35% 97 32,077,466 5.67% 584 5,570,179,581 11.12% 1,101 0 0.00% 0 0 0.00% 0 9,260 0.00% 0 Other Local and Intermediate * State Fiscal Stabilization Fund * This amount represents the amount of Foundation School Program funding that was financed by Federal State Fiscal Stabilization Fund funds distributed under the American Recovery and Reinvestment Act of 2009. This funding is included in the state category of the total revenue reported above. Total Receipts 416,947,064 100.00% 7,592 680,733,365 100.00% 12,395 61,709,215,617 100.00% 12,200 Total Revenue 391,986,466 94.01% 7,137 565,324,329 83.05% 10,293 50,087,166,792 100.00% 9,903 24,960,598 5.99% 454 24,960,598 3.67% 454 1,045,691,333 1.69% 207 0 0.00% 0 90,448,438 13.29% 1,647 10,576,357,492 17.14% 2,091 154,168,523 39.33% 2,807 318,444,680 56.33% 5,798 23,638,257,119 48.79% 4,844 2,121,063 0.54% 39 2,332,518 0.41% 42 336,813,447 0.70% 69 0 0.00% 0 155,224,570 27.46% 2,826 8,998,821,306 18.57% 1,844 Equity Transfers Total Other Resources Fund Balances (for ISDs) Total Fund Balance** Nonspendable Fund Balance Restricted Fund Balance Committed Fund Balance Assigned Fund Balance Unassigned Fund Balance 0 0.00% 0 0 0.00% 0 3,169,392,315 6.54% 649 19,869,851 5.07% 362 19,869,851 3.51% 362 1,568,139,410 3.24% 321 132,177,609 33.72% 2,407 141,017,741 24.94% 2,568 9,565,090,641 19.74% 1,960 398,988,292 100.00% 7,265 649,636,261 100.00% 11,829 53,356,468,731 100.00% 10,549 337,930,534 84.70% 6,153 368,274,705 56.69% 6,706 33,371,821,067 62.55% 6,598 60,856,675 15.25% 1,108 98,315,382 15.13% 1,790 9,200,026,920 17.24% 1,819 0 0.00% 0 116,410,627 17.92% 2,120 5,752,971,491 10.78% 1,137 201,083 0.05% 4 66,635,547 10.26% 1,213 5,031,649,253 9.43% 995 13 1,964,651 36 196,308,227 Disbursements Total Expenditures BY OBJECT Payroll Other Operating Debt Service Capital Outlay BY FUNCTION (Objects 6100-6400 only) Community Services (61) Total Operating Expenditures 702,471 39 398,084,738 100.00% 7,248 452,846,599 100.00% 8,245 42,115,353,056 100.00% 8,327 262,075,809 65.83% 4,772 282,323,358 62.34% 5,141 24,068,480,503 57.15% 4,759 Instructional Res Media (12) 7,369,301 1.85% 134 7,454,125 1.65% 136 559,766,483 1.33% 111 Curriculum/Staff Develop (13) 5,778,919 1.45% 105 7,969,536 1.76% 145 844,093,191 2.00% 167 Instructional Leadership (21) 2,861,064 0.72% 52 3,569,568 0.79% 65 620,036,278 1.47% 123 School Leadership (23) 22,351,769 5.61% 407 22,827,959 5.04% 416 2,448,365,599 5.81% 484 Guidance Counseling Svcs (31) 16,601,625 4.17% 302 18,034,247 3.98% 328 1,483,894,600 3.52% 293 859,832 0.22% 16 859,832 0.19% 16 116,464,358 0.28% 23 Health Services (33) 4,816,746 1.21% 88 5,027,694 1.11% 92 423,328,143 1.01% 84 Transportation (34) 10,948,376 2.75% 199 11,029,814 2.44% 201 1,230,360,430 2.92% 243 0 0.00% 0 21,753,594 4.80% 396 2,453,982,394 5.83% 485 Extracurricular (36) 6,520,748 1.64% 119 11,935,905 2.64% 217 1,189,979,319 2.83% 235 General Administration (41,92) 9,723,305 2.44% 177 10,008,537 2.21% 182 1,333,894,346 3.17% 264 Instruction (11,95) Social Work Services (32) Food (35) Plant Maint/Operation (51) 40,187,199 10.10% 732 41,522,614 9.17% 756 4,338,752,457 10.30% 858 Security/Monitoring (52) 3,202,154 0.80% 58 3,374,717 0.75% 61 341,028,225 0.81% 67 Data Processing Services (53) 4,787,891 1.20% 87 5,155,099 1.14% 94 662,926,730 1.57% 131 Total Disbursements 429,572,847 100.00% 7,822 710,849,812 100.00% 12,943 61,233,478,753 100.00% 12,106 Total Expenditures 398,988,292 92.88% 7,265 649,636,261 91.39% 11,829 53,356,468,731 100.00% 10,549 24,960,598 5.99% 454 24,960,598 3.67% 454 1,045,691,333 1.69% 207 0 0.00% 0 30,131,737 4.24% 549 6,276,036,153 10.25% 1,241 5,623,957 1.31% 102 6,121,216 0.86% 111 555,282,536 1.32% 110 Operating Expenditures - Program 331,819,959 100.00% 6,042 356,815,174 100.00% 6,497 31,518,985,822 100.00% 6,232 Regular 220,154,559 66.35% 4,009 222,844,967 62.45% 4,058 18,458,673,598 58.56% 3,649 Gifted and Talented 5,060,288 1.53% 92 5,060,288 1.42% 92 391,402,565 1.24% 77 Career and Technical 6,560,356 1.98% 119 7,051,974 1.98% 128 1,099,892,841 3.49% 217 61,728,536 18.60% 1,124 72,949,729 20.44% 1,328 4,891,115,377 15.52% 967 Accelerated Education 5,682,369 1.71% 103 8,093,684 2.27% 147 1,769,951,294 5.62% 350 Bilingual 5,999,762 1.81% 109 6,717,875 1.88% 122 1,001,463,454 3.18% 198 Nondisc Alt Ed-AEP Basic Serv 2,126,103 0.64% 39 2,127,998 0.60% 39 116,758,099 0.37% 23 Disc Alt Ed-DAEP Basic Serv 1,987,447 0.60% 36 1,990,354 0.56% 36 199,258,821 0.63% 39 Disc Alt Ed-DAEP Supplemental 0 0.00% 0 0 0.00% 0 19,173,440 0.06% 4 T1 A Schoolwide-St Comp>=40% 57 0.00% 0 3,993,436 1.12% 73 1,784,840,376 5.66% 353 Athletics/Related Activities 4,680,464 1.41% 85 5,830,007 1.63% 106 814,361,477 2.58% 161 High School Allotment 8,014,640 2.42% 146 8,014,640 2.25% 146 351,235,170 1.11% 69 Prekindergarten 9,825,378 2.96% 179 12,140,222 3.40% 221 620,859,310 1.97% 123 Equity Transfers Total Other Uses Intergovernmental Charge Program Expenditures Students with Disabilities District State Instructional Expenditure Ratio 69.3% 63.7% Maintenance and Operations 1.0400 1.0684 Interest and Sinking Funds 0.3334 0.1779 Total Tax Rate 1.3734 1.2463 Tax Rates 2012 (current tax year) Tax Rates 2011 Tax Year State Certified Property Values Amount Percent Property Value Amount Percent 33,031,539,922 N/A 1,690,389,404,780 N/A 601,437 N/A 334,204 N/A Business 11,914,855,831 33.16% 639,710,671,718 33.43% Residential 23,461,569,604 65.30% 1,038,314,240,215 54.26% 446,871,736 1.24% 119,764,498,626 6.26% 0 0.00% 106,011,217,520 5.54% 104,061,205 0.29% 9,779,388,732 0.51% Property Value per pupil Property Value by category: Land Oil and Gas Other ** Fund balance percentages are calculated by dividing the fund balance by either the general revenue or all funds. The percentages illustrate the size of the fund balance in relation to total revenues. Charter schools report net assets rather than fund balances.
