Role of surface and groundwater interactions on summertime streamflow in the Great Basin
advertisement

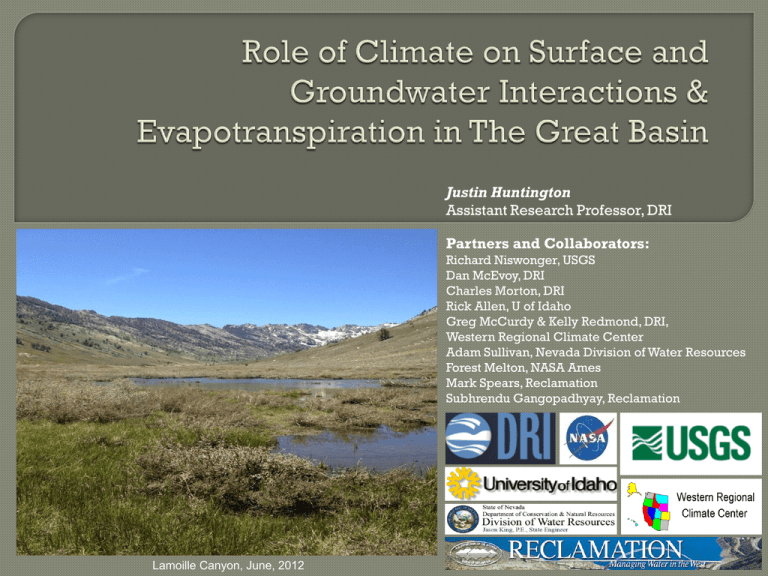
Justin Huntington Assistant Research Professor, DRI Partners and Collaborators: Richard Niswonger, USGS Dan McEvoy, DRI Charles Morton, DRI Rick Allen, U of Idaho Greg McCurdy & Kelly Redmond, DRI, Western Regional Climate Center Adam Sullivan, Nevada Division of Water Resources Forest Melton, NASA Ames Mark Spears, Reclamation Subhrendu Gangopadhyay, Reclamation Lamoille Canyon, June, 2012 The Great Basin is comprised of the driest states in the Nation • 1) Nevada, 2) Utah, 3) Wyoming, 4) Arizona 80 – 85% of available water is used is for agriculture Contains the most urbanized states in the nation (most of states’ population living in cities… i.e. Las Vegas, Salt Lake, etc..) Contains some of most sensitive flora and fauna in the Nation Understanding water sustainability and availability for natural biota, agriculture, and urban areas requires knowledge of surface and groundwater resources, their interactions, and their dependencies on climate Surface and Ground water interactions govern many important hydrologic processes such as groundwater recharge • evapotranspiration from wetlands phreatophyte shrubs that tap the shallow water table • groundwater discharge to streams that supply water for agriculture, wildlife, and stream biota during the hottest months of the year • Modified from USGS Circular 1139 Average annual air temperature has increased by ~1 - 1.5 oC since ~1950 in the Great Basin, and climate models are unanimous in predicting future warming,with most ranging from +3 to +6 oC over the next 50-100 yrs Precipitation is also projected to change, with most models showing decreasing trends over the Sierra Nevada and Southwest Intermountain Region Green Areas Indicate Wetland Areas Stewart et al., (2005) – J of Climate Luce and Holden, (2009) – Geophysical Research Letters We know current warming has impacted hydrology of the Great Basin and surrounding regions • Earlier spring runoff (Stewart et al., 2005) • Flows decreasing, especially dry year flows (25%ile) when groundwater plays a bigger role in the yearly flow (Luce and Holden, 2009) Are flows decreasing in the Great Basin? What are the mechanisms for the decreases in low water year flows, specifically low (i.e. summertime) flows? Identifying cause and effect can be a challange For example, 1.5 to 2 oC increase in the average Air Temp since 1953 at Sagehen Creek, CA (Tributary to Truckee River and USGS Benchmark Watershed) Does seem that there are more frequent low flow years, but is it because annual precipitation is slightly decreasing or temperature increasing since 1953? Sagehen Creek Near Truckee, CA Reduction in ~ 0.4 cfs since 1953 Near Tahoe City, CA Reduction of ~ 0.5 cfs since 1960 Near Elko, NV Reduction of ~ 3 cfs since 1945 Near Ely, NV Reduction of ~ 1.5 cfs since 1967 Hypothesis: Earlier snowmelt, groundwater recharge, and runoff could result in lower groundwater discharge to streams during summer months, even if annual precipitation and groundwater recharge increases Hydrologic processes such as runoff, groundwater recharge, and ET co-vary with time and space and are interdependent, making it extremely difficult to analyze causes and effects of climate for any one hydrologic process without an integrated framework to model these processes To test this hypothesis we focused on constructing an integrated surface water/groundwater model to explore the mechanics behind decreases in summertime streamflow We apply the integrated model to for simulation of • Snowpack development and melt • Infiltration and Runoff • Groundwater recharge • Groundwater and surface water interactions • ET from upland and groundwater discharge areas Integrated modeling provides the unique ability to investigate complex interactions, especially climate driven groundwater surface water interactions that have been largely ignored in the past by only using compartmental surface water models Construct and calibrate an integrated surface and groundwater hydrologic model (GSFLOW) for three watersheds in the Carson Range of the eastern Sierra Nevada that are tributary to Lake Tahoe and Truckee Meadows hydrographic areas of California and Nevada Forced the GSFLOW model with 6 general circulation model (GCM) results of daily temperature and precipitation over 100 years, with 2 models projecting increases in precipitation Evaluate changes in the hydrologic budget, especially groundwater discharge to streams under variable climate of increasing and decreasing precipitation Incline and Third Creek Markstrom, S.L., Niswonger, R.G., Regan, R.S., Prudic, D.E., and Barlow, P.M., 2008. Annual groundwater recharge and storage mimic precipitation but changes are enhanced Groundwater discharge to streams decreases, as recharge and storage decrease Streambed losses increase, as recharge, storage, and water levels decrease around the stream Result illustrates the important interplay between SW and GW and underscores the need for integrated simulations when making inferences about the effects of climate on these ineractions Losses to the groundwater reach a maximum as streamflow increases (depleted from summer and fall drainage) As stream stage increases, it suppresses groundwater discharge to the stream from reduced vertical hydraulic gradients beneath the streambed Causes the maximum groundwater discharge to follow the spring snowmelt and streamflow During the low flow period, streamflow becomes 100% comprised of net groundwater discharge As the streamflow timing shifts, so does the groundwater discharge, leaving less groundwater to discharge in the summer A) Early winter negligible recharge, groundwater storage and groundwater discharge B) Spring snowmelt with elevated stream head, seepage losses to bank storage and shallow aquifers, and suppressed shallow aquifer heads C) summer stream recession with peak shallow and regional groundwater dicharge to the stream D) late fall recession of groundwater discharge to the stream Soil Moisture decreases significantly, so does ET due to earlier flushing of moisture past the root zone Groundwater discharge to streams and summer streamflow decreases, even though annual precipitation increases (yellow & green projections) Huntington, J. L. and R. G. Niswonger (2012), Role of surface-water and groundwater interactions on projected summertime streamflow in snow dominated regions: An integrated modeling approach, Water Resources Research, doi:10.1029/2012WR012319, in press. Observed reductions in baseflow in the Great Basin are likely caused by a earlier snow-melt recession and groundwater discharge Earlier groundwater discharge to streams leaves more time for shallow aquifers to drain, reducing streamflow during the dry hot periods when demand for water is the highest Results from this work could be representative of watersheds that have well drained shallow soils with relatively impermeable bedrock below and are snow dominated Understanding impacts of decadal climate variability is important for us to focus on from a hydrologic perspective using past records of streamflow to learn from Watershed aquifers exhibits storage and drainage, and back to back wet years greatly sustain low flows (1995-2000) as compared wet to dry year low flows (2011-2012) Low flows for the last 2 months are still higher than low flows for any other“low snowpack year” back to 2001 even though last years snowpack was exceptionally low However it only takes one year of minimal snow pack to greatly impact low flows Sagehen Streamflow Sagehen PRISM PPT 13yr 13yr 1.8yr 6mo 1.8yr 4mo Sagehen Watershed Filters High Frequencies and Amplifies of Low Frequencies 6mo 4mo We would like to have indicators of hydrologic conditions across large spatial scales, and for unguaged watersheds -- Hard to build models for every watershed in the Great Basin Potential tools – Drought/Climate Indices - Example: Standardized Precipitation and Evapotranspiration Index – SPEI – Uses monthly precipitation and potential evapotranspiration Climate index time series gridded at 12km resolution for the Great Basin from 1895-pres. Lamoille Creek McEvoy, D., J. Huntington, J. T. Abatzoglou, and L. M. Edwards, (2012), An evaluation of multi-scalar drought indices in Nevada and Eastern California. Earth Interactions doi:10.1175/2012EI000447.1, in press. Climate and land surface feedbacks exist and is seen in evapotranspiration (LE) and potential evapotranspiration (LEp) When water is limited, available energy (Rn-G) is manifested into heat (H) instead of LE, increasing air temperature and reducing humidity, therefore increasing the PET Land surface Energy Balance - Rn - G = H + LE Photo by Mike Moreo, USGS Eddy Data from Spring, Snake, White River Valley, NV Huntington, J. L., J. Szilagyi, S. W. Tyler, and G. M. Pohll (2011), Evaluating the complementary relationship for estimating evapotranspiration from arid shrublands, Water Resour. Res., 47, W05533, doi:10.1029/2010WR009874. We exploit the ET and PET feedbacks and compute the departure from the long term mean PET per pixel We use solar radiation, temperature, humidity, and windspeed to compute PET If PET is higher than the mean for a given time period, than it must be dryer and hotter If PET is lower than the mean for a given time period, than it must be cooler and wetter Results compare fairly well with the Drought Monitor … amazing that is does since it uses no PPT data!! July 2005 Wet July 2007 Dry Red is dry, Blue is wet Remote sensing using the Landsat satellite and ground based weather data is likely the only way to estimate the “actual consumptive use” at field scales over large areas for assessing groundwater use, improved modeling of groundwater and surface water resources and interactions, water rights accounting, and drought monitoring Field Polygons Seasonal ET Recent Landsat Science News Article on DRI’s remote sensing energy balance work in the Great Basin (April 12, 2010) - Landsat can be an Impartial Arbitrator in Water Conflict Issues “Access to accurate ET maps produced using a widely accepted approach allows water resource managers to assess water use on a field by field basis in an objective way where everyone is treated equally.” “With equality of data for everyone, disputes over data or lack of data are reduced, which is a big change in how conflicts have been dealt with in the past.” Agriculture cooler due to “evaporative cooling” – energy consuming! Carson Valley, CA / NV 8/15/2009 Surface Temperature (Deserts ~ 125oF – Agriculture ~80oF) Energy balance gives us “actual” ET False Color Infrared Evapotranspiration (mm/d) Northern Mason Valley, 7/25/2008 We are able to simulate evaporation and ET at the field scale Energy balance “Sees” stress where reflectance has a hard time 2006 2009 ET (ft/yr) METRIC Average ET 2006 = 3.5ft METRIC Average ET 2009 = 2.6ft Average Annual ET = 3.0ft (Maurer and Berger, 2006) 2006 = 150% of normal flow 2009 = 80% of normal flow Yearly ET a function of supply AND Demand Fallon AGRIMET Fairview DRI station Difference in humidity can severely skew reference ET estimates and therefore crop ET estimates (follows complementary theory) Objective -better understand agricultural water demands and micro climates Operating since 2009-2010 East Snake Valley (UT) • Spring Valley • White River Valley • Steptoe Valley (2) • West • Truckee Meadows • Mason Valley • Smith Valley • Carson Valley • Bridgeport Valley North Lovelock Paradise Valley Antelope Valley Hualapai Flat South • Pahranagat Valley • Penoyer Valley (Rachel) • Panaca • AmargosaValley • Mojave (AZ) • Moapa Check it out! (nicenet.dri.edu) Stampede Reservoir, CA, Truckee River Basin, 2012 Comprehensive climate and streamflow study in the Great Basin to identify long term trends and identify cause and effect • Incorporate differences in geology and vegetation among watersheds Increase representative weather station data availability for computing reference ET and agricultural water demands (not nearly enough quality weather station data to use, however people demand estimates of crop ET that are accurate!) Potentially combine the NICE Net with the Utah State Ag. Weather Network to form a “Great Basin Ag. Weather Network” to increase funding opportunities…. Both are State networks, are broke, yet local and federal agencies rely on the data…. We need to all “pitch in” Gridded weather data at < 1Km spatial resolution and daily time steps to provide ability to develop climate indices and force fine and regional scale hydrologic and crop demand models across all Western States Develop a buoy weather station network for estimating open water evaporation Push for funding of Landsat 9 Questions? Contact Information Justin.Huntington@DRI.edu 775-673-7670 Many thanks to: Great Basin Climate Forum Nevada Division of Water Resources USGS Reclamation NASA Ames Cal. State University, Monterey Bay Truckee River Operating Agreement Staff University of Idaho Spatial Analysis Group Landsat Water Mapping Inc. Winnemucca Lake (Truckee River Basin)


