advertisement
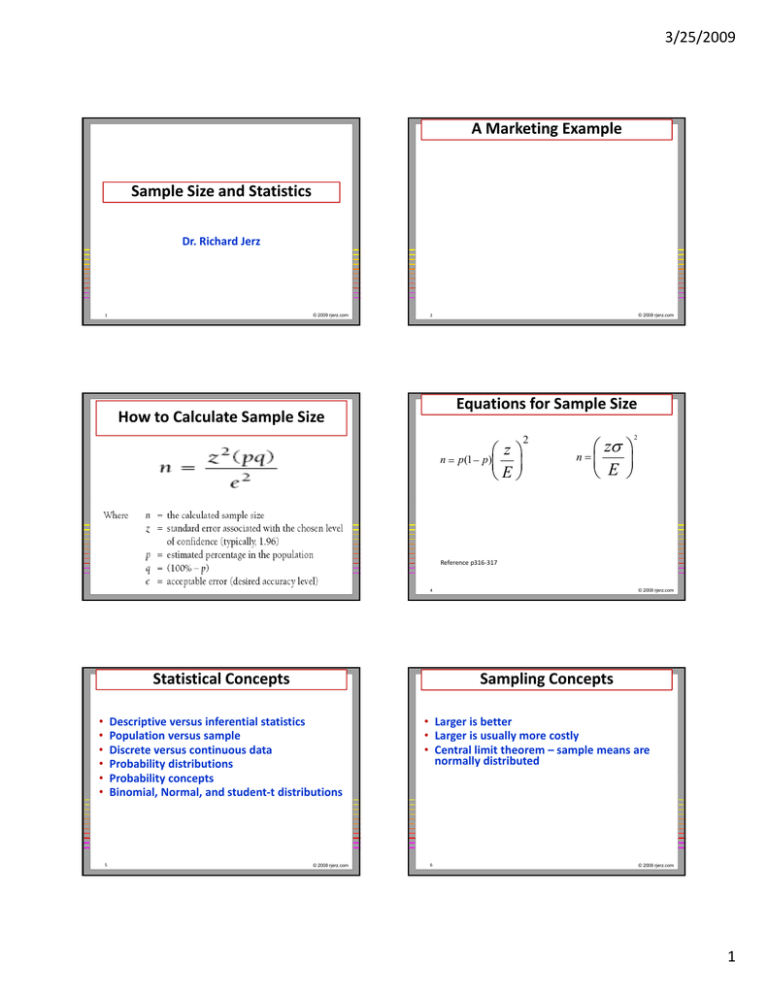
3/25/2009 A Marketing Example Sample Size and Statistics Dr. Richard Jerz 1 © 2009 rjerz.com 2 © 2008 rjerz.com Equations for Sample Size How to Calculate Sample Size z n p (1 p ) E 2 z n E 2 Reference p316‐317 4 Statistical Concepts Sampling Concepts Descriptive versus inferential statistics Population versus sample Discrete versus continuous data Probability distributions Probability concepts Binomial, Normal, and student‐t distributions • • • • • • 5 © 2008 rjerz.com © 2008 rjerz.com • Larger is better • Larger is usually more costly • Central limit theorem – sample means are normally distributed 6 © 2008 rjerz.com 1 3/25/2009 Basis of Business Decisions M&M Count M&M Percentages 30% 6 26% 5 25% 5 4 3 16% 10% Red Blue Yellow 5% Red Orange Blue Brown Yellow 0% Green 5% 0 Green 1 1 Brown 2 Probability of Green M&M's in Bag # of Green M&M's in Bag 60% 9 50.0% 50% 3 Percent 10 9 8 7 6 5 4 3 2 1 0 16% 15% 3 Count 16% Orange 3 21% 20% 4 3 Tossing 2 Dice 3 2 1 40% 30% 20% 10% 0 16.7% 16.7% 4 5 11.1% 5.6% 0.0% 0.0% 0% 1 2 3 4 # in Bag 5 6 1 2 3 6 7 # in Bag 7 © 2008 rjerz.com 8 Confidence Intervals – Continuous Normal Data 9 © 2009 rjerz.com Another View of Normally Distributed Data © 2008 rjerz.com 10 A Marketing Example © 2008 rjerz.com Confidence Interval Estimates for the Mean Use Z‐distribution Use t‐distribution • If the population • If the population standard deviation is standard deviation is known or the sample is unknown and the greater than 30. sample is less than 30. +/‐ Error, E 11 © 2008 rjerz.com 12 © 2009 rjerz.com 2 3/25/2009 Comparing the z and t Distributions when n is small 13 © 2009 rjerz.com Calculate Sample Size 14 Sample Size Determination for a Variable • To find the sample size for a variable: zs n E © 2008 rjerz.com Problems with Sample Size • Sigma is for population • Need to know sigma for population 2 • • • • where : E - the allowable error Solutions (From Lind, p315) Use a comparable study Use a range‐based approach (range/6) Conduct a pilot study z - the z - value corresponding to the selected level of confidence s - the sample deviation (from pilot sample) 15 © 2009 rjerz.com 16 Calculating Sample Size © 2008 rjerz.com One more problem • Excel model • We may not know the population sigma • Solution: Student‐t distribution • Problem: not explained by Lind (and others) • Solution: Excel ‐ Goal Seek 17 © 2008 rjerz.com 18 © 2008 rjerz.com 3 3/25/2009 Why Dr. Shoemaker’s Solution? Characteristics: • There are only two possible outcomes on a particular trial of an experiment. • The outcomes are mutually exclusive, The random variable is the result of counts. • The random variable is the result of counts. • Each trial is independent of any other trial • Examples: • p is for binomial data z n p(1 p ) E Binomial Probability Distribution (discrete) 2 • • • • 19 © 2008 rjerz.com 20 Binomial Probability Formula 21 © 2009 rjerz.com Yes or no True or false On or off Correct or incorrect © 2009 rjerz.com Binomial Distribution: n, x, π 22 © 2009 rjerz.com Some Interesting Characterists Binomial – Shapes for Varying (n constant) • As n increases, binomial distribution starts looking normal • As p gets close to .5, binomial distributions starts looking normal • Given this, you can use the normal Given this you can use the normal distribution to estimate the binomial 23 © 2009 rjerz.com 24 © 2008 rjerz.com 4 3/25/2009 Equations for Sample Size Problems with this approach z n p (1 p ) E • What is E? • E is the allowable error, expressed as a percent (a value between 0 and 1) • What is p? 2 z n E 2 • How much will you pay for this cookie? • Will it sell if it’s price was $1.00? • p is the probability of success. Most conservative estimate is .5 25 © 2008 rjerz.com 27 © 2008 rjerz.com 26 © 2008 rjerz.com 5


