Demographic State of the Nation: 1997
advertisement

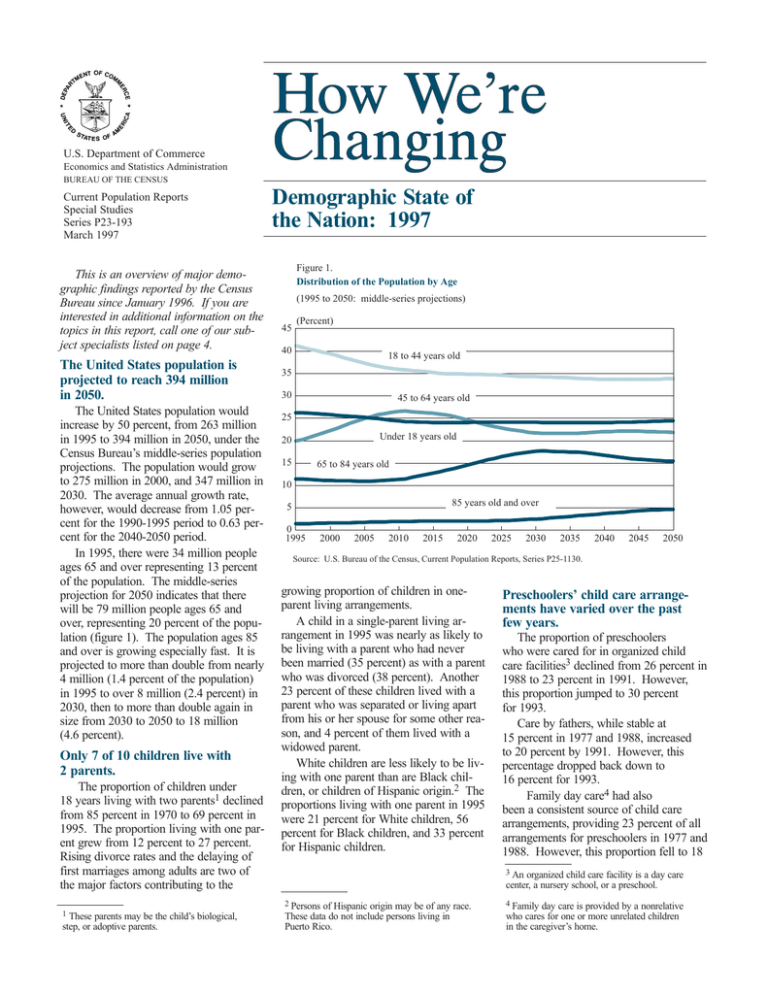
U.S. Department of Commerce Economics and Statistics Administration BUREAU OF THE CENSUS Current Population Reports Special Studies Series P23-193 March 1997 This is an overview of major demographic findings reported by the Census Bureau since January 1996. If you are interested in additional information on the topics in this report, call one of our subject specialists listed on page 4. The United States population is projected to reach 394 million in 2050. The United States population would increase by 50 percent, from 263 million in 1995 to 394 million in 2050, under the Census Bureau’s middle-series population projections. The population would grow to 275 million in 2000, and 347 million in 2030. The average annual growth rate, however, would decrease from 1.05 percent for the 1990-1995 period to 0.63 percent for the 2040-2050 period. In 1995, there were 34 million people ages 65 and over representing 13 percent of the population. The middle-series projection for 2050 indicates that there will be 79 million people ages 65 and over, representing 20 percent of the population (figure 1). The population ages 85 and over is growing especially fast. It is projected to more than double from nearly 4 million (1.4 percent of the population) in 1995 to over 8 million (2.4 percent) in 2030, then to more than double again in size from 2030 to 2050 to 18 million (4.6 percent). Only 7 of 10 children live with 2 parents. The proportion of children under 18 years living with two parents1 declined from 85 percent in 1970 to 69 percent in 1995. The proportion living with one parent grew from 12 percent to 27 percent. Rising divorce rates and the delaying of first marriages among adults are two of the major factors contributing to the 1 These parents may be the child’s biological, step, or adoptive parents. Demographic State of the Nation: 1997 Figure 1. Distribution of the Population by Age (1995 to 2050: middle-series projections) 45 (Percent) 40 18 to 44 years old 35 30 45 to 64 years old 25 Under 18 years old 20 15 65 to 84 years old 10 85 years old and over 5 0 1995 2000 2005 2010 2015 2020 2025 2030 2035 2040 2045 2050 Source: U.S. Bureau of the Census, Current Population Reports, Series P25-1130. growing proportion of children in oneparent living arrangements. A child in a single-parent living arrangement in 1995 was nearly as likely to be living with a parent who had never been married (35 percent) as with a parent who was divorced (38 percent). Another 23 percent of these children lived with a parent who was separated or living apart from his or her spouse for some other reason, and 4 percent of them lived with a widowed parent. White children are less likely to be living with one parent than are Black children, or children of Hispanic origin.2 The proportions living with one parent in 1995 were 21 percent for White children, 56 percent for Black children, and 33 percent for Hispanic children. Preschoolers’ child care arrangements have varied over the past few years. The proportion of preschoolers who were cared for in organized child care facilities3 declined from 26 percent in 1988 to 23 percent in 1991. However, this proportion jumped to 30 percent for 1993. Care by fathers, while stable at 15 percent in 1977 and 1988, increased to 20 percent by 1991. However, this percentage dropped back down to 16 percent for 1993. Family day care4 had also been a consistent source of child care arrangements, providing 23 percent of all arrangements for preschoolers in 1977 and 1988. However, this proportion fell to 18 3 An organized child care facility is a day care center, a nursery school, or a preschool. 2 Persons of Hispanic origin may be of any race. These data do not include persons living in Puerto Rico. 4 Family day care is provided by a nonrelative who cares for one or more unrelated children in the caregiver’s home. 2 Demographic State of the Nation: 1997 percent in 1991 and remained at this historically low level in 1993. From 1988 to 1991, the decline in the use of organized child care facilities and family day care providers, and the increase in care by fathers, may have been a rational response to the economic recession which occurred during the same time period. A higher proportion of fathers who were unemployed or working at parttime jobs meant that more of them were available to serve as child care providers. Moreover, parents may have wanted to cut down on child care costs by switching to parental supervision whenever possible. Figure 2. Educational Attainment by Race and Hispanic Origin: March 1995 (Percent in age group 25 years old and over) 83.0% High school degree or more Overall, post-secondary attainment levels are higher for men than for women. While there was no statistical difference in 1995 between men and women ages 25 and over in terms of high school completion (both 82 percent), 46 percent of women and 50 percent of men had completed some college or more. Twenty-six percent of men had obtained a bachelor’s degree, compared with only 20 percent of women. There are also sizable differences in high school completion rates among Whites, Blacks, and persons of Hispanic origin ages 25 and over (figure 2). Among Whites, 83 percent have at least a high school degree, compared with 74 percent for Blacks, and 53 percent for persons of Hispanic origin. However, the gap between the educational attainment of the White and Black populations ages 25 to 29 has narrowed. While the proportion of persons with at least a high school degree remained relatively unchanged for the younger White population (87 percent) during the last decade, the proportion of Blacks in the same age category with a high school 73.8% 53.4% 49.0% Some college or more 37.5% 27.1% 24.0% Bachelor’s degree or more 13.2% 9.3% Educational attainment levels continue to rise. In March 1995, 82 percent of all adults ages 25 and over had completed at least high school and 23 percent had earned a bachelor’s degree or more. Both figures are the highest ever recorded in the United States. The rise in educational attainment for the general adult population is driven principally by the replacement of older, less–educated people by younger people who have completed substantially more education. For example, in 1995, 87 percent of persons 25 to 34 years old had completed high school, compared with 57 percent of persons ages 75 and over. White Black Hispanic origin (of any race) Source: U.S. Bureau of the Census, Current Population Reports, Series P20-489. degree increased from 81 percent in 1985 to 87 percent in 1995.5 Nearly 1 in 11 Americans are foreign born.6 The estimated 23 million foreign-born persons in 1995 represented 8.8 percent of the U.S. population (nearly 1 in 11). While this is substantially larger than the 4.8 percent foreign born in 1970, a much greater proportion of the U.S. population was foreign born during the early part of this century. The percent foreign born declined from a high of 14.7 percent in 1910 to a low of 4.8 in 1970, and then increased steadily (although there was no significant change from 1994 to 1995). Among the foreign born in 1995, 68.0 percent were White, 7.2 percent were Black, and 18.4 percent were Asian and Pacific Islander. Nearly half (46.4 percent) of all foreign-born persons were of Hispanic origin. More than one-quarter (6.7 million) of the total foreign-born population in 1995 were born in Mexico. The Philippines was the second largest country of origin, with 1 million persons born there. Over half a million foreign-born persons came from each of the following countries: Canada, China, Cuba, the Dominican 5 There was no statistically significant difference in high school completion rates between White and Black persons ages 25 to 29 in 1995. Republic, El Salvador, Jamaica, Korea, Germany, Great Britain, and Poland. California had the largest foreign-born population in 1995, over 7.7 million persons, or one-quarter of all California residents. New York ranked second in the number of foreign born with 3.0 million. Other States with large numbers of foreign born include Texas (2.1 million), Florida (2.0 million), New Jersey (1.1 million), and Illinois (1.0 million).7 For the first time in 6 years, households8 in the United States experienced an overall increase in real median income. From 1994 to 1995, real median household income9 increased by 2.7 percent, from $33,178 to $34,076. Even though income remains below its 1989 prerecessionary peak of $35,421 (in 1995 dollars), the gap is narrowing. In 1994, real median household income was 6.3 percent below the 1989 level; in 1995, it was 3.8 percent below the 1989 level. Moreover, selected groups have returned to their 1989 median income levels. Households in the Midwest, Black households, family households maintained by a woman with no husband present, and 7 The differences in number of foreign born between Texas and Florida and between New Jersey and Illinois are not significant. 8 A household is a group of people who occupy a housing unit. 9 All 6 Natives are persons born in the United States, Puerto Rico, or an insular area of the United States such as Guam or the U.S. Virgin Islands, and persons who were born in a foreign country but who had at least one parent who was a U.S. citizen. All other persons are foreign born. changes in real income and real earnings refer to comparisons after adjusting for inflation. The income data in this section are based on money income from regularly received sources before taxes and exclude capital gains and the value of noncash benefits, such as employment-based health insurance or food stamps. Bureau of the Census 3 households maintained by persons 55 to 64 years old all had incomes in 1995 comparable to their 1989 incomes. Historically, the long-term trend among households has been toward increasing income inequality. However, from 1994 to 1995, the amount of inequality in the distribution of income remained unchanged. In fact, the share of aggregate income for the lowest quintile10 increased (by 0.1 percentage points), while the other four quintiles showed no significant change. Although the percentages of both men and women who worked year round, full time increased from 1994 to 1995, neither gender experienced an increase in real earnings. In fact, the real median earnings of women working year round, full time declined from $22,834 in 1994 to $22,497 in 1995—a 1.5 percent drop after adjusting for inflation. In 1995, the median earnings of men was $31,496. The female-to-male earnings ratio for year-round, full-time workers in 1995 was 0.71, not statistically different from the all-time high ratio of 0.72 reached in 1990. There was a significant drop in both the number of people living below the poverty level and the poverty rate from 1994 to 1995. In 1995, the number of people below the official government poverty level was 36.4 million, representing 13.8 percent of the Nation’s population—both significantly lower than the corresponding 1994 figures of 38.1 million poor and a poverty rate of 14.5 percent. However, the 1995 poverty rate is still higher than the 1989 rate of 13.1 percent, the most recent low point achieved during the economic expansion of November 1982 to July 1990 (figure 3). Children under 18 continue to represent a very large segment of the poor (40 percent) even though they make up only about one-fourth of the total population. Children under age 6 have been particularly vulnerable. In 1995, the overall poverty rate for related11 children under 6 years of age was 23.7 percent. 10 Households are ranked from lowest to highest according to household income, then divided into five equal-sized groups. 11 Related children in a family include own children and all other children in the household who are related to the householder by blood, marriage, or adoption. Figure 3. Poverty: 1959–95 45 45 40 40 35 Number in poverty (millions) 30 36.4 35 30 32.4 25 25 20 20 15 15 10 13.1% Poverty rate (percent) 5 0 1959 1962 1965 1968 1971 1974 13.8% 10 5 1977 1980 1983 1986 1989 1992 1995 Recessionary periods. Source: U.S. Bureau of the Census, Current Population Reports, Series P60-194. Figure 4. Type of Health Insurance Coverage Americans Had in 1995 All persons Poor persons Private insurance Any private plan 70.3% 22.3% Employmentbased Medicare Medicaid Military health care* 61.1% 14.6% Government insurance 13.1% 11.6% 12.1% 46.4% 3.5% 2.1% No insurance No insurance 15.4% 30.2% *Military health care includes CHAMPUS (Comprehensive Health and Medical Plan for Uniformed Services), CHAMPVA (Civilian Health and Medical Program of the Department of Veteran’s Affairs), and Veteran’s and military health care. Note: The percentages by type of coverage are not mutually exclusive; in others words, persons can be covered by more than one type of health insurance during the year. Source: U.S. Bureau of the Census, Current Population Reports, Series P60-195. Over 40 million people do not have health insurance. Throughout the entire 1995 calendar year, an estimated 41 million people in the United States (15.4 percent of the population) were without health insurance (unchanged from the previous year). Most people (70.3 percent) were covered by a private insurance plan for some or all of 1995. Most private insurance was employment-based, in that it was obtained through a current or former employer or union (figure 4). The remaining insured people had government coverage, including Medicare (13.1 percent), Medicaid (12.1 percent), and military health care (3.5 percent). Many people are covered by more than one plan. Despite the existence of programs such as Medicaid and Medicare, 30.2 percent of the poor (11 million) had no health insurance of any kind during 1995. This percentage—which was double the rate for all people—was unchanged from the previous year. Poor people comprised 27.1 percent of all uninsured people. Medicaid was the most widespread type of coverage among the poor, covering 46.4 percent of them at some time during 1995. 4 Demographic State of the Nation: 1997 In 1995, 65 percent of occupied housing units were lived in by their owners.13 This is the highest homeownership rate since 1983, and 0.7 percentage points above the 1994 rate. 12 Major means-tested programs include Aid to Families with Dependent Children (AFDC), General Assistance, food stamps, Supplemental Security Income (SSI), Medicaid, and housing assistance. 13 Homeownership data were compiled from the Housing Vacancy Survey. 13.5 14.0 12.7 11.4 11.2 11.5 1987 1988 1990 1991 1992 1993 Source: U.S. Bureau of the Census, Current Population Reports, Series P70-58. Married-couple families were much more likely to own their own homes than were other types of family or nonfamily households—80 percent in 1995, compared with 55 percent for families maintained by men and 45 percent for families maintained by women. In 1995, 51 percent of one-person households owned their own homes. The homeownership rate was 44 percent for men living alone and 55 percent for women living alone. There were 113 million housing units in the United States in 1995, of which 65 million were owner occupied, 35 million were renter occupied, and 13 million were vacant. National population projections 457-2397 Kevin Deardorff Living arrangements 457-2465 Arlene Saluter Child care 457-2416 Lynne Casper Educational attainment 457-2464 Jennifer Day Foreign-born population 457-2454 Carol Faber Income HHES Information Area 763–8576 Poverty HHES Information Area 763–8576 Health insurance HHES Information Area 763-8576 Program participation 763-8375 Jan Tin Homeownership and vacancies 763-8165 Robert Callis General information on this report 457-2390 Jean Bradley Source and Accuracy of Estimates Data presented here are from the Current Population Survey, the Survey of Income and Program Participation, and the Housing Vacancy Survey, as well as from independent population estimates and projections. The survey data are subject to sampling variability as well as to survey design errors, respondent classification and reporting errors, and data processing errors. The Census Bureau has taken steps to minimize errors, and statistical statements have been tested and meet statistical standards. Further information can be found in the detailed reports. U.S. Department of Commerce The 1995 homeownership rate was at its highest level since 1983. (Percent) For further information, call (301): BUREAU OF THE CENSUS Washington, DC 20233 Of the estimated 258 million civilians living in the United States in 1993, approximately 36 million (14.0 percent) participated in at least one of the major means-tested assistance programs, compared with about 27 million (11.4 percent) in 1987 (figure 5). In 1993, the average monthly participation rate for Medicaid (10.3 percent) was higher than that for food stamps, AFDC or General Assistance, housing assistance, or SSI. Only 8.6 percent of persons participated in these programs in all 24 months of the 1992-93 period. These long-term recipients were likely to be children or persons at least 65 years old. About 14.1 percent of children and 9.7 percent of the elderly participated in these programs in each month of 1992 and 1993, compared with 6.0 percent of persons who were 18 to 64 years old. Figure 5. Average Monthly Participation in at Least One Means-Tested Program: 1987–88 and 1990–93 OFFICIAL BUSINESS Penalty for Private Use. $300 About 1 in 7 Americans participated in major means-tested assistance programs in 1993. 12 FIRST CLASS MAIL POSTAGE & FEES PAID BUREAU OF THE CENSUS PERMIT NO. G-58


