Sulfur Dioxide: Episodic Injection Evidence for Active Venus Volcanism
advertisement
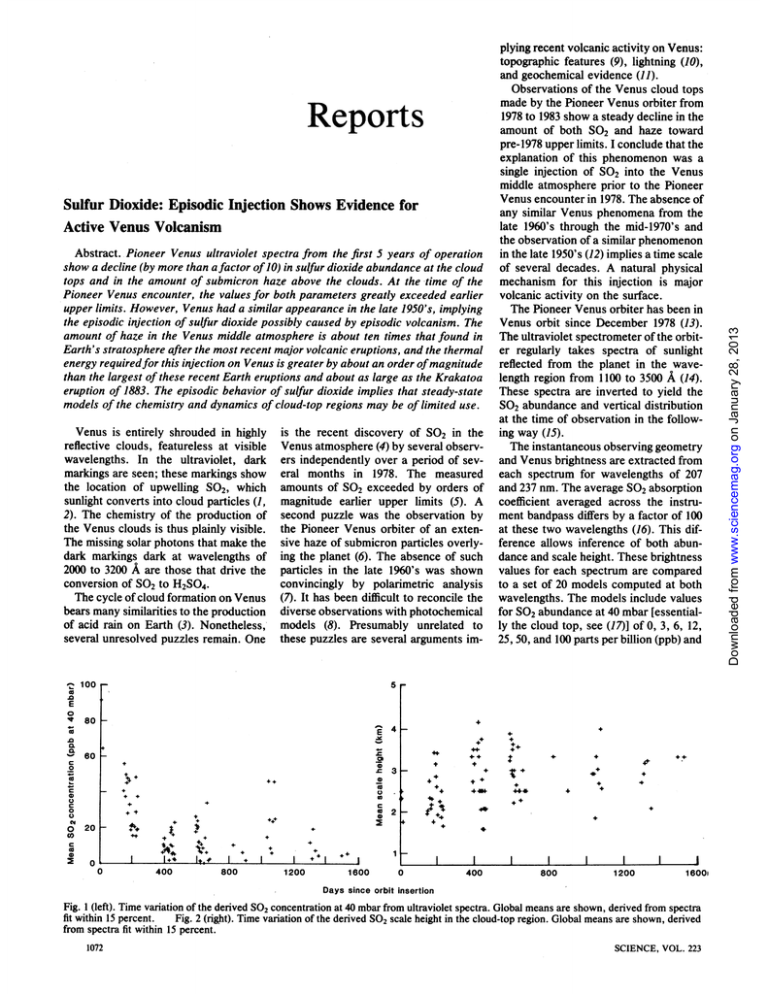
Reports Sulfur Dioxide: Episodic Injection Shows Evidence for Active Venus Volcanism Abstract. Pioneer Venus ultraviolet spectra from the first 5 years of operation show a decline (by more than a factor of10) in sulfur dioxide abundance at the cloud tops and in the amount of submicron haze above the clouds. At the time of the Pioneer Venus encounter, the values for both parameters greatly exceeded earlier upper limits. However, Venus had a similar appearance in the late 1950's, implying the episodic injection of sulfur dioxide possibly caused by episodic volcanism. The amount of haze in the Venus middle atmosphere is about ten times that found in Earth's stratosphere after the most recent major volcanic eruptions, and the thermal energy requiredfor this injection on Venus is greater by about an order ofmagnitude than the largest of these recent Earth eruptions and about as large as the Krakatoa eruption of 1883. The episodic behavior of sulfur dioxide implies that steady-state models of the chemistry and dynamics of cloud-top regions may be of limited use. Venus is entirely shrouded in highly reflective clouds, featureless at visible wavelengths. In the ultraviolet, dark markings are seen; these markings show the location of upwelling S02, which sunlight converts into cloud particles (1, 2). The chemistry of the production of the Venus clouds is thus plainly visible. The missing solar photons that make the dark markings dark at wavelengths of 2000 to 3200 A are those that drive the conversion of SO2 to H2SO4. The cycle of cloud formation on Venus bears many similarities to the production of acid rain on Earth (3). Nonetheless,several unresolved puzzles remain. One 0- is the recent discovery of SO2 in the Venus atmosphere (4) by several observers independently over a period of several months in 1978. The measured amounts of SO2 exceeded by orders of magnitude earlier upper limits (5). A second puzzle was the observation by the Pioneer Venus orbiter of an extensive haze of submicron particles overlying the planet (6). The absence of such particles in the late 1960's was shown convincingly by polarimetric analysis (7). It has been difficult to reconcile the diverse observations with photochemical models (8). Presumably unrelated to these puzzles are several arguments im- 100 Observations of the Venus cloud tops made by the Pioneer Venus orbiter from 1978 to 1983 show a steady decline in the amount of both SO2 and haze toward pre-1978 upper limits. I conclude that the explanation of this phenomenon was a single injection of S02 into the Venus middle atmosphere prior to the Pioneer Venus encounter in 1978. The absence of any similar Venus phenomena from the late 1960's through the mid-1970's and the observation of a similar phenomenon in the late 1950's (12) implies a time scale of several decades. A natural physical mechanism for this injection is major volcanic activity on the surface. The Pioneer Venus orbiter has been in Venus orbit since December 1978 (13). The ultraviolet spectrometer of the orbiter regularly takes spectra of sunlight reflected from the planet in the wavelength region from 1100 to 3500 A (14). These spectra are inverted to yield the S02 abundance and vertical distribution at the time of observation in the following way (15). The instantaneous observing geometry and Venus brightness are extracted from each spectrum for wavelengths of 207 and 237 nm. The average SO2 absorption coefficient averaged across the instrument bandpass differs by a factor of 100 at these two wavelengths (16). This difference allows inference of both abundance and scale height. These brightness values for each spectrum are compared to a set of 20 models computed at both wavelengths. The models include values for S02 abundance at 40 mbar [essentially the cloud top, see (17)] of 0, 3, 6, 12, 25, 50, and 100 parts per billion (ppb) and 5 co E m 0 80 K .% .0 CL c 4- E 60 _- 4+ -0 +4 0 0 .S0 4+ C) -0 20 + 44i.*-+4 400 1+ 4 0 0 0 400 40,+ c 02 2 cn c0I 41 + + 0 44. +4. + ++ c 0 t +4 .' 3 4. 0 0 4 +> 4. + 4+ .b. I. # I Boo + I 1200 I 1600 1 I 0 400 I 800 1200 16001 Days since orbit insertion Fig. I (left). Time variation of the derived SO2 concentration at 40 mbar from ultraviolet spectra. Global means are shown, derived from spectra fit within 15 percent. Fig. 2 (right). Time variation of the derived SO2 scale height in the cloud-top region. Global means are shown, derived from spectra fit within 15 percent. 1072 SCIENCE, VOL. 223 Downloaded from www.sciencemag.org on January 28, 2013 plying recent volcanic activity on Venus: topographic features (9), lightning (10), and geochemical evidence (11). G. 9 MARCH 1984 25 E 20 _.. &L15 0 o 10 c5 0 o5 0 0 0.1 0.2 0.3 0.4 0.5 0.6 0.7 0.8 0.9 Cosine of the emission angle 1 Fig. 3. Histogram of the mean SO2 concentrathe cosine of the tion as a function of emission angle (data from 925 spectra fit within 15 percent). No observations for < 0.2. opposite effect is seen, with slightly lowderived values of SO2 abundance at smaller IL values. Lacking laboratory data on which to base more complicated models and finding no evidence of systematic errors, I conclude that the current models are satisfactory. Other possible ways to explain the data without requiring that the global amount of SO2 in the cloud-top region decrease by an order of magnitude also lack force. The SO2 is not covered up by haze: the haze decreases as rapidly over the same period (6). Moreover, the SO2 is not hidden by an uplift of the main cloud. To the inversion algorithm, this would appear as a smaller scale height (21). Figure 2 shows that the scale height increases over this time. Furthermore, on theoretical grounds it appears that the SO2 scale height is maintained by photochemical destruction at the cloud tops (1, 2, 8). Thus, if the SO2 were hidden by a brighter layer above it, this destruction would cease and the SO2 would be rapidly transported upward by mixing into the previously pristine layer. The time scale for the transport is only months, given derived eddy mixing rates (22). Thus, such a situation could not persist for years unless the supply of SO2 is decreased at a lower level in the Venus atmosphere. All that is clearly shown by the ultraviolet spectrometer data is the disappearance of S02 from the cloud-top region. However, earlier upper limits (5) are much lower than the amount seen at Pioneer Venus encounter in 1978. This result, coupled with the sudden multiple observations (4), provides strong evidence of a rapid increase in the amount of SO2 at the cloud tops before the Pioneer Venus encounter. Esposito and Travis showed (17) that there is a negative correlation between the submicron haze (6) at any given instant and the amount of SO2. The er natural interpretation of this is a conservation of sulfur atoms between the gas (SO2) and the haze aerosol (H2SO4). Since the particles are produced from the SO2 gas, this would naturally explain the observed long-term positive correlation: as the global amount of SO2 declines, so should the production of haze aerosols. Indeed, Kawabata et al. show (23) that the amount of submicron haze decreased by an order of magnitude over the first 1000 days of the Pioneer Venus mission. Like the SO2, this submicron haze was at a historic high in 1978 (24). The especial brightness of the polar regions at this time is also accounted for by the haze. The last major occurrence of bright polar caps in 1959 has also been associated with submicron particles at the cloud tops (12). The conclusion from these facts is straightforward: (i) SO2 is episodically injected above the Venus cloud tops; (ii) this SO2 is rapidly converted to new, small aerosols of H2SO4, seen as a haze and especially bright polar regions; and (iii) these aerosols rapidly grow and fall out into the main cloud deck, which would give rise to decade-long periods during which neither small aerosols nor SO2 is seen. An appealing explanation for the observed SO2 injection and resulting haze formation is episodic voicanism. Radar studies by the Pioneer Venus orbiter (9) have detected topographic features on Venus that resemble terrestrial volcanic landforms. Prinn (11) argues that the observed amount of SO2 in the lower atmosphere is out of equilibrium with the surface composition measured by the latest Venera landers (25). This current imbalance requires a geologically recent source of sulfur compounds at the surface. It is well known that major volcanic eruptions give rise to a haze layer of submicron particles in Earth's atmosphere. The mass of aerosols in the earth's stratosphere after the eruptions of El Chich6n in 1982 approached 1013 g (26). Vertical optical depths measured in Earth's polar regions exceeded 0.1 (27). The total mass of the Venus polar haze inferred by Kawabata et, al. (6) is 2 x l0'4 g; the optical depth of the Venus polar haze exceeds 1.0. Thus the amount of aerosols injected into the Venus middle atmosphere is greater by at least an order of magnitude than that associated with the most recent volcanic episodes on Earth. Volcanism is not the only possible cause for middle atmospheric injection on Venus. The SO2 abundance (28) differs by an order of magnitude above and 1073 Downloaded from www.sciencemag.org on January 28, 2013 values for the SO2 scale height of 1.25, 1.7, 2.5, and 5.0 km. The basic type of model is similar to that used by Esposito (2); the outgoing reflected brightness, including multiple scattering, vertical inhomogeneity, and observing geometry, is calculated explicitly by the Markov chains method (18). The best combination of values for abundance and scale height is that which minimizes the meansquare difference between the actual brightness and the model brightness at the two wavelengths. If this root-meansquare difference is larger than 15 percent of the observed brightness, no model is deemed a satisfactory fit. Of 1179 spectra taken by the ultraviolet spectrometer in the first 1600 orbits, for 925 (78 percent) a satisfactory fit was found. For each of the 90 orbits containing spectra, the derived values are averaged to give global means for SO2 abundance and scale height. These means are plotted against orbit number in Figs. 1 and 2 (orbit insertion was on 4 December 1978). Figure 1 shows a clear decline from approximately 100 ppb on orbit 2 to less than 10 ppb by orbit 1500. Belton has criticized (19) earlier work in which this method was used to derive the SO2 distribution. He stated that the SO2 spectrum is not continuous but is actually composed of lines unresolved by current laboratory studies. If this is true, then the models used in this analysis will be in error since they take into account only known structure in the SO2 cross section (16). On the other hand, no laboratory spectra of high enough resolution exist in this wavelength regioh (2000 to 2400 A). Furthermore, because of predissociation at these wavelengths (20), there is good reason to expect a continuum, consistent with the models used. Lacking a laboratory determination on this matter, we can check to see if the models used here show any systematic variations consistent with Belton's hypothesis. Because the complicated line structure suggested by Belton would be interpreted according to the above inversion as an inhomogeneous vertical distribution of SO2, we could expect systematic failures as we viewed higher in the atmosphere, that is, as the line of sight went toward the limb. These would be in the sense of deriving larger SO2 concentrations for observations closer to the limb. Figure 3 shows the derived SO2 amount as a function of ,u, the cosine of the emission angle. For radial viewing , = 1; as we go to the limb ,u goes to No effect of the sort predicted by Belton's hypothesis is seen. In fact the - Rebere uiX Notes pedwe on hegtan nexperimental measureinent of the entrainment rate 1. L.- W. Esposito, J. R. Winick, A. I. Stewart, Res. Lett. 6, 601 (1979). (the speed at wbich ambient gas is mixed 2. Geo,phys. L. W. Esposito, J. Geophys. Res. 85, 8151 (1980). into the rising column). For a standard 3. W. B. DeMore and Y. L. Yung, Science 217, Earth atmosphere (31, 32), 1209 (1982). 4. E. S. Barker, Geophys. Res. Lett. 6, 117 (1979); R. R. Conway, R. P. McCoy, C. A. Barth, A. L. H = 8.2 Q/4 (4) Lane, ibid., p. 629; A. I. Stewart, D. E. Anderson, Jr., L. W. Esposito, C. A. Barth, Science where H is measured in meters, and Q is 203, 777 (1979). the rate of thermal energy release in 5. T. Owen and C. Sagan, Icarus 16, 557 (1972); D. P. Cnrikshank and G. P. Kuiper, Commun. watts. Although it is simplistic and igLunar Planet. Lab. 6, 196 (1967. K. Kawabata et al., J. Geophys. Res. 85, 8129 nores radiative cooling, Eq. 4 gives a 6. (1980). satisfactory explanation for the height of 7. J. E. Hansen and J. W. Hovenier, J. Atmos. Sci. 1137 (1974). volcanic plumes from recent terrestrial 8. 31, J. R. Winick and A. I. F. Stewart, J. Geophys. eruptions (32, 33). Res. 85, 7849 (1980); Y. L. Yung and T. B. Icarus 51, 199 (1982). For Venus, the average observed 9. DeMore, H. Masursky et al., J. Geophys. Res. 85, 8232 G. E. McGill et al., in Venus, D. M. (1980); lapse rate between the surface and 50 km Hunten, L. Colin, T. M. Donahue, V. I. Moroz, is 7.7 K/km and the mean adiabatic lapse Eds. (Univ. of Arizona Press, Tucson, 1983), 69-130. rate is 8.9 K/km (29). Correcting Eq. 4 10. pp. F. W. Scarf and C. T. Russell, Geophys. Res. for the conditions at the Venus surface Lett., in press. R. G. Prinn, in Recent Advances in Planetary (29), we find that a plume on Venus will 11. Meteorology, G. E. Hunt, Ed. (Cambridge rise - 0.6 as high as one on Earth creatUniv. Press, Cambridge, in press). 12. A. M. R. Santer, Astron. J. 84, Auriere, Dollfus, ed by a volcano with the same thermal 1419 (1979). output. Thus, to reach a height of 50 km 13. L. Colin, J. Geophys. Res. 85, 7575 (1980). A. I. F. Stewart, IEEE Trans. Geosci. Remote on Venus, the volcanic eruption must 14. Sensing 18, 65 (1980). 15. L. W. Esposito et al., in preparation. have a thermal output Q t 10t6 W. This 16. P. Warneck, F. F. Marmo, J. 0. Sullivan, J. rate of heat production is about 10 to 100 Chem. Phys. 40, 1132 (1964). 17. L. W. Esposito and L. D. Travis, Icarus 51, 374 times that from well-documented major (1982). terrestrial volcanic eruptions of the last 18. L. W. Esposito, Astrophys. J. 233, 661 (1979). 19. M. J. S. Belton, Icarus 52, 149 (1982). century (32-34). Such large heat produc- 20. H. Okabe, Photochemistry of Small Molecules (Wiley, New York, 1978). tion has been supplied by historical erupinversion algorithm does not include models tions, including Krakatoa (1883) (35) and 21. The in which the SO2 is covered by a layer of cloud particles. However, the models are designed to Tanibora (1815) (36). On Earth, such match various gradients of absorption with inmassive explosions might occur only creasing optical depth into the Venus atmosphere. Thus, SO2 lying lower with nonabsorbonce per century or less. ing cloud above would be interpreted as a steepPhillips and Malin (37) have suggested er gradient or a smaller scale height. R. Woo and A. Ishimaru, Nature (London) 289, that volcanic activity may be more vigor- 22. 383 (1981); U. von Zahn, K. H. Frickej D. M. Hunten, 0. Krnkowsky, K. Mauersberger, A. ous on Venus than oh Earth because of Nier, J. Geophys. Res. 85, 7829 (1980). the lac'of organized plate tectopics on 23. 0. K. Kawabata, M. Sato, L. D. Travis, in preparation. Venus. The more vigorous volcanic acL. D. Travis et al., Science 205, 74 (1979). tivity on Venus might be due to larger 24. 25. V. I. Moroz, in Venus, D. M. Hunten, L. Colin, T. M. Donahue, V. I. Moroz, Eds. (Univ. of volcanoes, a greater number of volcaArizona Press, Tucson, 1983), pp. 45-68. noes, or more frequent eruptions. The 26. G. E. Thomas et al., Geophys. Res. Lett., in last two of these possibilities could ac- 27. p ress. . P. McCormick, paper presented at the International Union of Geodesy and Geophysics, count for a higher frequency of SO2 Gerniany, August 1983. injections into the visible Venus atmo- 28. Hamburg, U. von Zahn, S. Kumar, H. Niemann, R. Prinn, sphere. in Venus, D. M. Hunten, L. Colin, T. M. Donahue, V. I. Moroz, Eds. (Univ. of Arizona This recent injection can account for Press, Tucson, 1983), pp. 299-432. 29. Seiff, ibid., pp. 215-279. the current geochemical imbalance be- 30. A. L. W. Esposito et al., ibid., pp. 484-564. tween the surface and atmosphere noted 31. B. R. Morton, G. Taylor, J. S. Turner, Proc. R. London Ser. A 234, 1 (1956). by Prinn (11) and also the failure of 32. Soc. L. Wilson, R. S. J. Sparks, T. C. Huang, N. D. J. Geophys. Res. 83, 1829 (1978). steady-state photochemical models to 33. Watkins, M. Settle, J. Volcanol. Geotherm. Res. 3, 309 match both the small scale height of SO2 (1978). B. M. Jakosky, in preparation. F=gQ and the upper limits on 2 (8, 38). Since 34. M. N. van Padang, in Volcano of Thera (Arche35. Tpcp S02 is the major precursor of the Venus ological Services of Greece, Athens, 1971); Bull. 25, 373 (1963). where p is the atmospheric density and clouds and an important absorber of so- 36. S.Volcanol. Self, M. R. Rampino, M. S. Newton, J. A. Eos 64, 873 (1983). cp is the specific heat. The atmospheric lar radiation, steady-state models of the 37. Wolff, R. J. Phfllips and M. C. Malin, in Venus, D. M. chemistry and dynamics of the cloud-top stability is Hunten, L. Cohn, T. M. Donahue, V. I. Moroz, Eds. (Univ. of Arizona Press, Tucson, 1983), must be The used region cautiously. + n)(3 gF(l s= T (3) abundances of other chemically active 38. pp.. T.159-214. Trauger and J. I. Lunine, Icarus 55, 272 constituents such as C12, CO, and poly- 39. I(1983). am grateful for useful discussions with H. morphic sulfur must also experience Masursky, R. Prinn, A. Young, W. B. Rossow, C. A. Barth, J. L. Bertaux, A. I. F. Stewart, R. is the ratio of the observed atmospheric coupled episodic variations. A. West, G. E. Thomas, and B. M. Jakosky. I -LARRY W. ESPOSITO thank M. Copley, who reduced the spectral lapse rate to F (for an adiabatic atmodata. This research was supported by the Piosphere, n = -1). The proportionality Laboratory for Atmospheric and Space neer Venus Project office and the NASA Planetary Atmospheres Program (NAGW-389). constant in Eq. 1 is given by a numerical Physics, University of Colorado, 20 September 1983; accepted 4 January 1984 calculation of the upward velocity de- Boulder 80309 ~~~~(2) 1074 SCIENCE, VOL. 223 Downloaded from www.sciencemag.org on January 28, 2013 below thei:tbleW layer in the Venus atmosphere at 40 to 50 kni (29).-Any largescale mechanism that mixes S02 across this layer would result in a massive injection into the cloud-top region. A satisfactory mechanism must account for both the long time scale (decades) and the method of breaking through the stable layer below the clouds. Volcanic eruptions fit with the long time between such injections. The time scales for atmospheric phenomena would seem much shorter, that is, about 1 month (28) at the cloud tops. In a volcanic eruption, the emitted gases (and the entrained atmosphere) have positive buoyancy (30). The heated colurmnnof gases is a convective plume, which can rise to great heights even in a stable stratified atmosphere (31), as on Venus. A plume must rise to a height of about 50 km to reach the unstable region in the Venus middle cloud at 50 to 57 km (29, 30). At this altitude, no further expenditure of buoyancy is required: the warm column of erupted gases and entrained air does not lose heat as fast through expansion as the atmospheric temperature falls with altitude. Thus, any injected gases reaching this height would rise through the middle cloud and be muxed into the region of photochemical production of H2SO4 in the upper cloud (57 to 70 km), where they are "visible" to remote-sensing devices (30). The ability of a buoyant plume to rise in a stably stratified medium has been studied by Morton et al. (31). The height, H, attained by a buoyant plume is proportional to the fourth root of the input of buoyant flux, F, at the surface, and inversely proportional to the 3/K power of the atmospheric stability, s: H ~ F"4s-318 (1) The buoyant flux is given by the thermal input Q multiplied by the coefficient of expansion (lIT for gases, where T is the surface temperature) divided by the thermal capacity and multiplied by the gravitational acceleration, g:
