LETTER
doi:10.1038/nature12783
Distinct fibroblast lineages determine dermal
architecture in skin development and repair
Ryan R. Driskell1,2, Beate M. Lichtenberger1,2*, Esther Hoste2,3*, Kai Kretzschmar1,2*, Ben D. Simons4, Marika Charalambous5,
Sacri R. Ferron5, Yann Herault6, Guillaume Pavlovic6, Anne C. Ferguson-Smith5 & Fiona M. Watt2
Fibroblasts are the major mesenchymal cell type in connective
tissue and deposit the collagen and elastic fibres of the extracellular
matrix (ECM)1. Even within a single tissue, fibroblasts exhibit considerable functional diversity, but it is not known whether this
reflects the existence of a differentiation hierarchy or is a response
to different environmental factors. Here we show, using transplantation assays and lineage tracing in mice, that the fibroblasts
of skin connective tissue arise from two distinct lineages. One
forms the upper dermis, including the dermal papilla that regulates
hair growth and the arrector pili muscle, which controls piloerection.
The other forms the lower dermis, including the reticular fibroblasts
that synthesize the bulk of the fibrillar ECM, and the preadipocytes
and adipocytes of the hypodermis. The upper lineage is required for
hair follicle formation. In wounded adult skin, the initial wave of
dermal repair is mediated by the lower lineage and upper dermal
fibroblasts are recruited only during re-epithelialization. Epidermal
b-catenin activation stimulates the expansion of the upper dermal
lineage, rendering wounds permissive for hair follicle formation.
Our findings explain why wounding is linked to formation of ECMrich scar tissue that lacks hair follicles2–4. They also form a platform
for discovering fibroblast lineages in other tissues and for examining fibroblast changes in ageing and disease.
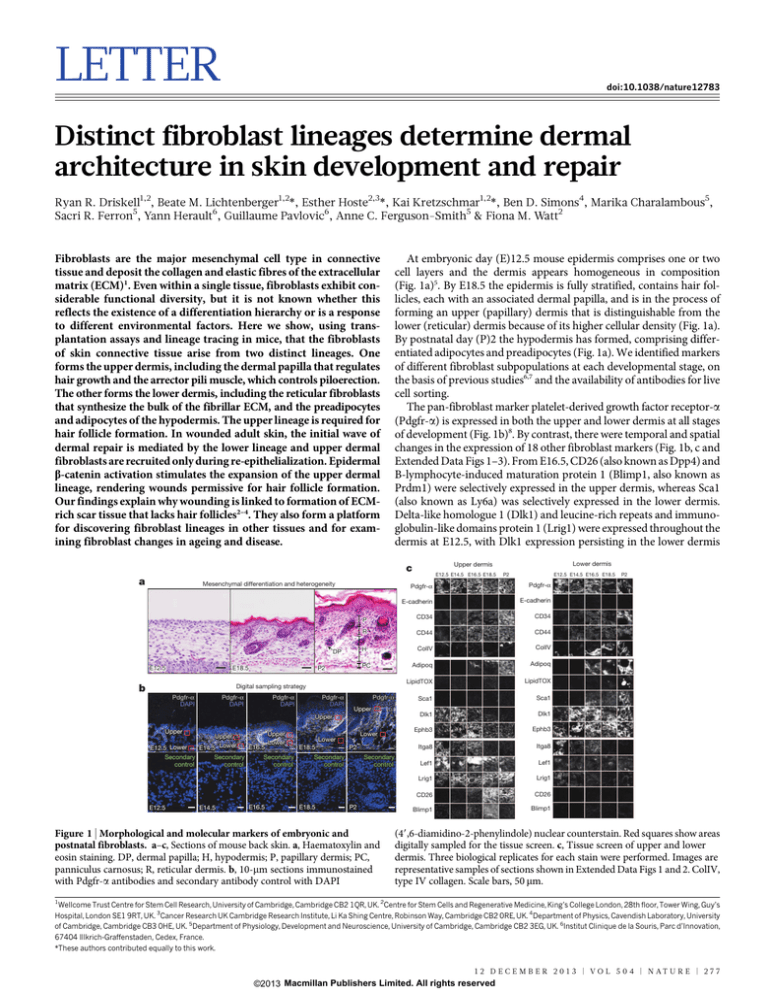
At embryonic day (E)12.5 mouse epidermis comprises one or two
cell layers and the dermis appears homogeneous in composition
(Fig. 1a)5. By E18.5 the epidermis is fully stratified, contains hair follicles, each with an associated dermal papilla, and is in the process of
forming an upper (papillary) dermis that is distinguishable from the
lower (reticular) dermis because of its higher cellular density (Fig. 1a).
By postnatal day (P)2 the hypodermis has formed, comprising differentiated adipocytes and preadipocytes (Fig. 1a). We identified markers
of different fibroblast subpopulations at each developmental stage, on
the basis of previous studies6,7 and the availability of antibodies for live
cell sorting.
The pan-fibroblast marker platelet-derived growth factor receptor-a
(Pdgfr-a) is expressed in both the upper and lower dermis at all stages
of development (Fig. 1b)8. By contrast, there were temporal and spatial
changes in the expression of 18 other fibroblast markers (Fig. 1b, c and
Extended Data Figs 1–3). From E16.5, CD26 (also known as Dpp4) and
B-lymphocyte-induced maturation protein 1 (Blimp1, also known as
Prdm1) were selectively expressed in the upper dermis, whereas Sca1
(also known as Ly6a) was selectively expressed in the lower dermis.
Delta-like homologue 1 (Dlk1) and leucine-rich repeats and immunoglobulin-like domains protein 1 (Lrig1) were expressed throughout the
dermis at E12.5, with Dlk1 expression persisting in the lower dermis
a
Mesenchymal differentiation and heterogeneity
DP
E12.5
PdgfrPdgfr-α
DAPI
Pdgfr-α
PdgfrDAPI
PdgfrPdgfr-α
DAPI
PdgfrPdgfr-α
DAPI
E-cadherin
P
CD34
CD34
R
CD44
CD44
H
ColIV
ColIV
Upper
PdgfrPdgfr-α
DAPI
Upper
Lower
Upper
Upper
Lower
Lower
E16.5
E18.5
P2
E12.5 Lower
E14.5 Lower
Secondary
Secondary
Secondary
Secondary
Secondary
control
control
control
control
control
E14.5
E16.5
E18.5
E12.5 E14.5 E16.5 E18.5
E-cadherin
Upper
E12.5
P2
Pdgfr-α
Digital sampling strategy
b
E12.5 E14.5 E16.5 E18.5
Pdgfr-α
PC
P2
E18.5
Lower dermis
Upper dermis
c
P2
Figure 1 | Morphological and molecular markers of embryonic and
postnatal fibroblasts. a–c, Sections of mouse back skin. a, Haematoxylin and
eosin staining. DP, dermal papilla; H, hypodermis; P, papillary dermis; PC,
panniculus carnosus; R, reticular dermis. b, 10-mm sections immunostained
with Pdgfr-a antibodies and secondary antibody control with DAPI
Adipoq
Adipoq
LipidTOX
LipidTOX
Sca1
Sca1
Dlk1
Dlk1
Ephb3
Ephb3
Itga8
Itga8
Lef1
Lef1
Lrig1
Lrig1
CD26
CD26
Blimp1
Blimp1
P2
(49,6-diamidino-2-phenylindole) nuclear counterstain. Red squares show areas
digitally sampled for the tissue screen. c, Tissue screen of upper and lower
dermis. Three biological replicates for each stain were performed. Images are
representative samples of sections shown in Extended Data Figs 1 and 2. ColIV,
type IV collagen. Scale bars, 50 mm.
1
Wellcome Trust Centre for Stem Cell Research, University of Cambridge, Cambridge CB2 1QR, UK. 2Centre for Stem Cells and Regenerative Medicine, King’s College London, 28th floor, Tower Wing, Guy’s
Hospital, London SE1 9RT, UK. 3Cancer Research UK Cambridge Research Institute, Li Ka Shing Centre, Robinson Way, Cambridge CB2 0RE, UK. 4Department of Physics, Cavendish Laboratory, University
of Cambridge, Cambridge CB3 0HE, UK. 5Department of Physiology, Development and Neuroscience, University of Cambridge, Cambridge CB2 3EG, UK. 6Institut Clinique de la Souris, Parc d’Innovation,
67404 Illkrich-Graffenstaden, Cedex, France.
*These authors contributed equally to this work.
1 2 D E C E M B E R 2 0 1 3 | VO L 5 0 4 | N AT U R E | 2 7 7
©2013 Macmillan Publishers Limited. All rights reserved
RESEARCH LETTER
a
CD26+ Sca1– papillary dermis
b
c
H2B–eGFP
LipidTOX
Dlk1+ Sca1– reticular dermis
H2B–eGFP
Itga8
g
SG
Reticular/hypodermis sorted out
Dlk1+ Sca1+ hypodermis
Papillary/reticular dermis sorted out
Dlk1– Sca1+ hypodermis
CD26+Sca1–
Flow-sorted
Pdgfr-α-H2B–eGFP
fibroblast subpopulations
CD26+Sca1–
H2B–eGFP
LipidTOX
H2B–eGFP
Itga8
1 × 10⁵ cells
Dlk1+Sca1–
8 × 10⁶ cells
h
Positive control - all cells
5 × 10⁶ cells
8 × 10⁶ cells
Disaggregated
WT epithelium
Dlk1+Sca1–
Positive control all cells
Flow-sorted
Pdgfr-α-H2B–eGFP
fibroblast subpopulations
5 × 10⁶ cells
No reticular/
hypodermis
Chamber
H2B–eGFP
Itga8
H2B–eGFP
LipidTOX
Nude/BALB/c
Disaggregated
WT dermis
Dlk1+Sca1+
Dlk1+Sca1+
H2B–eGFP
LipidTOX
i
H2B–eGFP
Itga8
H2B–eGFP
Itga8
Nude/BALB/c
Dlk1–Sca1+
Dlk1–Sca1+
Positive control - all cells
e
150
H2B–eGFP
Itga8
No reticular/hypodermis
f
*
50
Dermis
Dlk1+
Sca1–
Hypodermis
Dlk1+
Sca1+
200
*
100
5
**
**
**
H2B–eGFP
Itga8
2.5
Dlk1–
Sca1+
No
Positive
No
control reticular/ papillary/
hypo- reticular
dermis
dermis
k
CD26+Sca1–
*
CD26+
Sca1–
j
0
100
0
H2B–eGFP
Itga8
**
*
**
Per cent contribution to
ectopic DP
Number of H2B–eGFP cells per location
d
No papillary/
reticular dermis
Number of hairs per graft
Chamber
0
CD26+ Dlk1+ Dlk1+ Dlk1–
Sca1– Sca1– Sca1+ Sca1+
No papillary/reticular
papillary/reticular dermis
Number of GFP DP per 120 μm
Disaggregated
WT epithelium
100
*
50
**
0
No
Positive
No
control reticular/ papillary/
hypo- reticular
dermis
dermis
Figure 2 | Skin-reconstitution assays. a, Experimental set-up for b–f.
b, c, Grafts immunostained with DAPI counterstain (blue). SG, sebaceous
gland. Arrows, APM. d–f, Contribution of Pdgfr-a-H2B–eGFP cells to
dermal compartments. DP, dermal papilla. g, Experimental set-up for h–k.
h, Macroscopic views of grafts. i, Contribution of GFP1 cells to grafts. Arrows,
GFP1 dermal papilla. j, Hair follicles per graft. k, GFP1 dermal papillae per 120mm graft. n 5 3 biological replicates per experiment. *P , 0.05, **P , 0.005.
Horizontal whole mounts shown. Scale bars, 40 mm (b, c), 30 mm (e),
2.5 mm (h), 50 mm (i).
from E18.5 and Lrig1 expression persisting in the upper dermis. The
changes in abundance of CD261, Sca11 and Dlk11 cells were confirmed
by flow cytometry of green fluorescent protein (GFP)1 dermal cells from
Pdgfr-a-H2B–eGFP mice8 (in which enhanced GFP (eGFP) is fused to
histone H2B) (Extended Data Fig. 3). Several of the markers were also
differentially expressed in neonatal human skin (Extended Data Fig. 4).
To evaluate the differentiation potential of different dermal fibroblasts (Fig. 2a), cells were flow sorted from P2 Pdgfr-a-H2B–eGFP
dermis8 (Extended Data Fig. 5c–e), combined with unlabelled epidermal
and dermal cells and injected into chambers implanted into nude
BALB/c mice9. Papillary dermal cells (CD261 Sca12) contributed
exclusively to the upper dermis (Fig. 2b–d and Extended Data Fig. 6a),
including the dermal papilla and arrector pili muscle (APM) (Fig. 2e, f).
Hypodermal fibroblasts (Dlk11 Sca11 and Dlk12 Sca11) differentiated into adipocytes but not into APM or dermal papilla (Fig. 2b–d
and Extended Data Fig. 6c, d). Dlk11 Sca12 cells, located primarily at
the boundary between the reticular dermis and hypodermis (Extended
Data Fig. 5a, b), contributed to all dermal mesenchymal compartments
(Fig. 2b–d and Extended Data Fig. 6b). However, although we cannot rule
out the existence of multipotent fibroblasts in adult skin, Dlk11 Sca12
cells did not persist after P10, when Dlk1 was no longer expressed in the
dermis (Extended Data Fig. 4d and data not shown).
The number of hair follicles was higher in grafts containing upper
dermal (CD261 Sca12) cells than Dlk12 Sca11 hypodermal cells
(Extended Data Fig. 6e–i). Dlk12 Sca11 cells are a subpopulation of
Lin2 CD341 CD291 Sca11 adipocyte precursors, which also express
Pdgfr-a (Extended Data Fig. 5f–i)10. To establish whether hypodermal
cells were less effective at supporting hair follicle formation we compared control grafts containing unfractionated P2 Pdgfr-a-H2B–
eGFP1 cells with grafts in which we excluded papillary/reticular cells
(CD261, Dlk11 and Sca12 cells depleted) or reticular/hypodermal
cells (Dlk11/2 Sca11 cells depleted) (Fig. 2g–k and Extended Data
Fig. 6j–l). As CD26, Dlk1 and Sca1 are not expressed in the dermal
papilla at this stage (data not shown) all grafts contained dermal papilla
cells. The contribution of GFP1 cells to the grafts was extensive in all
cases (Fig. 2i). Hair follicle formation was similar in the grafts of
unfractionated dermal cells and those depleted of reticular and hypodermal cells. By contrast, when the papillary and reticular dermal cells
were excluded very few hair follicles formed (Fig. 2h–k). Thus P2 skin
contains cells that are restricted to forming either the upper or lower
dermal lineages on skin reconstitution, the upper dermal cells being
required for hair follicle formation.
We next performed lineage tracing with specific promoters. We crossed
Dlk1-CreER mice with Rosa-CAG-loxP-stop-loxP (LSL)-tdTomato
mice (hereafter LSL-tdTomato mice, in which tdTomato is expressed
when the stop codon is removed via Cre-mediated recombination),
then labelled with tamoxifen at E12.5 (when all fibroblasts are Dlk11;
Fig. 1c) or E16.5 (when only reticular fibroblasts express Dlk1; Fig. 1c)
and collected at P2 or P21 (Fig. 3a–k). Flow cytometry established that
the labelling accuracy was over 95% (Extended Data Fig. 7a–c). When
Dlk1-expressing cells were labelled at E12.5, all of the dermal mesenchymal compartments (Pdgfr-a1) were labelled (Fig. 3a–d). By contrast,
when cells were labelled at E16.5 the only labelled fibroblasts were
reticular and hypodermal cells, including mature adipocytes (Fig. 3e–k).
2 7 8 | N AT U R E | VO L 5 0 4 | 1 2 D E C E M B E R 2 0 1 3
©2013 Macmillan Publishers Limited. All rights reserved
LETTER RESEARCH
CAG
b
Labelling
CreER
×
tdTomato
E12.5
tamoxifen
injection
Itga8
tdTomato
c
d
P21
Harvest
Itga8
tdTomato
AMP
DP
l
***
***
100
Blimp1-Cre/
CAG-CAT-eGFP
50
p
E12.5–P21
f
CD26
tdTomato
E16.5–P2
Dlk1
E16.5–P2
Labelling
E16.5
P21
Harvest
tamoxifen
injection
Itga8
Lipid
tdTomato
j
Adipo
E16.5–P21
o
GFP
Itga8
***
***
***
50
IRES
CreER
×
tdTomato
Lrig1-GFP
tdTomato
E16.5–P2
v
Lrig1-CreER/tdTomato
Blimp1-Cre/
CAG-CAT-eGFP
Labelling
E16.5
P2
Harvest
tamoxifen
injection
s
Itga8
tdTomato
E16.5–P21
Lrig1-CreER/tdTomato
P14
GFP
Itga8
Blimp1-Cre/
CAG-CAT-eGFP
q
Labelling
E16.5
P21
Harvest
tamoxifen
injection
t
Itga8
tdTomato
E16.5–P21
Lrig1-CreER/tdTomato
w
Multipotent and committed fibroblast lineages
**
20
NS
0
Papillary APM Dermal Reticular/
dermis
papilla/ hypodermal dermis
sheath
Dermal fibroblast lineage hierarchy
P2
F
k
100
***
50
0
P2
E12.5
E16.5
P2
P21
***
***
Multipotent
fibroblast
Lineage of
Blimp1 cells
Lineage of Dlk1 cells
labelled at E16.5
Papillary APM Dermal Reticular/
dermis
papilla/ hypodermal dermis
sheath
F
E12.5
**
10
E16.5
Papillary APM Dermal Reticular/
dermis
papilla/ hypodermal dermis
sheath
P50
u
0
Pre adipocyte
precursor
lineage
CAG
CreER
×
tdTomato
Dlk1
tdTomato
100
n
Papillary
lineage
i
g
eGFP
P2
Multipotent
fibroblasts
CAG
Labelling
E16.5
P2
Harvest
tamoxifen
injection
CreER
×
tdTomato
Per cent labelled per hair follicle
Dlk1
Per cent labelled per hair follicle
h
e
Lrig1
r
Papillary APM Dermal Reticular/
dermis
papilla/ hypodermal dermis
sheath
Blimp1-Cre/
CAG-CAT-eGFP
E16.5
CAG
Adipo
GFP
Itga8
***
0
E12.5–P21
m
GFP
Itga8
Per cent labelled per hair follicle
Dlk1
Per cent labelled per hair follicle
a
Papillary
dermal
fibroblast
progenitor
Pdgfr-α+
Blimp1+
Dlk1–
Lrig1+
Papillary
dermal
fibroblast
Pdgfr-α+
CD26+
Blimp1–
Lrig1+
Common
E16.5
fibroblast
progenitor Reticular/hypodermal
Pdgfr-α+
dermal
Dlk1+
fibroblast
Lrig1+
progenitor
Pdgfr-α+
Blimp1–
Dlk1+
Dermal
papilla
Pdgfr-α+
Blimp1+
CD26–
Sox2+/–
APM
Pdgfr-α–
Itga8+
CD26–
P2
Reticular
fibroblast
Pdgfr-α+
Dlk1+
Sca1–
P2
Adipocyte
Pdgfr-α–
Dlk1–
Lipid+
Hypodermal
fibroblast
Pdgfr-α+
Dlk1+/–
Sca1+
Figure 3 | Fibroblast lineage commitment during skin development.
a, e, i, p, q, Labelling strategies. b, c, f, g, j, l–o, r–t, Contribution of labelled cells
to different dermal compartments. Adipo, adipocyte; DP, dermal papilla.
d, h, k, u, Average number of labelled cells per unit area of dermis (defined by
hair follicle spacing). v, w, Schematic summary of lineage restriction. n 5 3
biological replicates analysed per experiment. Sections counterstained with
DAPI. NS, not significant. **P , 0.005, ***P , 0.0005. Scale bars, 50 mm.
Therefore after E16.5 dermal fate restriction occurs, such that cells
expressing Dlk1 only give rise to the lower dermal lineages. We confirmed this by examining adipogenesis of dermal cells in culture
(Extended Data Fig. 3d–g; see Supplementary Information)6,11.
We next performed lineage tracing with Blimp1-Cre. Between E16.5
and E18.5, Blimp1 was expressed in the dermal papilla, dermal sheath
and papillary dermis (Fig. 1c and Extended Data Fig. 7d, e)12,13, but
from P2 through adulthood dermal Blimp1 expression was confined to
the dermal papilla and dermal sheath (Extended Data Fig. 7f, g).
Blimp1-expressing epidermal and endothelial cells (Extended Data
Fig. 7h, i)13–15 were excluded from analysis on the basis of co-expression
of relevant markers. The fidelity of the Blimp1 promoter was established by flow sorting (Extended Data Fig. 7j, k).
At all time points, dermal papilla and dermal sheath cells were
labelled in Blimp1-Cre 3 CAG-CAT-eGFP (hereafter LSL-GFP) mice
(Fig. 3l–o). At E16.5 the papillary dermis was unlabelled (Fig. 3l), but at
E18.5 the papillary dermis contained GFP1 cells, consistent with the
pattern of endogenous Blimp1 expression (Extended Data Fig. 7e, h).
From P14 onwards all APM were GFP1, and only a few GFP1 fibroblasts remained in the papillary dermis (Fig. 3n, o). Thus P2 papillary
dermal fibroblasts are the progenitors of the APM. Labelled papillary
fibroblasts never contributed to the reticular dermis or hypodermis.
We used Lrig1 as an additional marker for lineage tracing16 (Figs 1c,
3r–u and Extended Data Fig. 7l–q). The specificity of the Lrig1-GFPIRES-CreER reporter line17 was confirmed by flow cytometry (Extended
Data Fig. 7n). P2 dermal cells from Lrig1-GFP-IRES-CreER 3 LSLtdTomato crosses treated with tamoxifen at E16.5 expressed Pdgfr-a
and CD26 but not Sca1 (Extended Data Fig. 7n–q). At P2 labelling was
restricted to the papillary dermis (Fig. 3r and Extended Data Fig. 7m).
At P21 the APM and papillary dermis were labelled, whereas the
reticular dermis and fat were unlabelled (Fig. 3s–u). Our data suggest
that loss of papillary dermis after the first hair follicle cycle8,18 is due to
differentiation of papillary fibroblasts into the APM, which was further
confirmed by clonal analysis in Pdgfr-a-CreER 3 LSL-GFP mice
(Extended Data Fig. 8). It is interesting that the papillary dermis is
more pronounced in human skin, which has fewer hair follicles and
therefore fewer APMs, than mouse skin5. We conclude that from E16.5
the developing dermis undergoes fate restriction such that cells in the
upper dermis that express Lrig1 or Blimp1 give rise to the dermal
papilla, APM and papillary fibroblasts, whereas Dlk1-positive cells in
the lower dermis give rise to the reticular dermis, hypodermis and
adipocyte layer (Fig. 3v, w).
To investigate how fibroblasts of different lineages contribute to
skin repair, we created full-thickness wounds in adult back skin. We
ruled out any contribution of bone-marrow-derived cells to the Pdgfr-a1
dermal compartment (Extended Data Fig. 9a–k and Supplementary
Information). When Pdgfr-a-CreER 3 LSL-tdTomato mice that had
been injected with tamoxifen at E17.5 were wounded in adulthood, we
found tdTomato1 cells throughout the repairing dermis (Extended
Data Fig. 9l, n). When we examined wound healing in Dlk1-CreER
3 LSL-tdTomato mice that had been injected with tamoxifen at E16.5
to selectively label the lower dermis (Fig. 4a–c and Extended Data
Fig. 10a, b), a large proportion of wound fibroblasts, including cells that
expressed the myofibroblast marker a-smooth muscle actin19 (Extended
Data Fig. 10b), were tdTomato1 (Fig. 4b, c). In adult skin of Blimp1Cre 3 LSL-GFP mice only upper dermal fibroblasts and CD311
endothelial cells were GFP1 (Fig. 4e). Seven days after wounding no
GFP1 fibroblasts were present in the wound bed (Fig. 4e and Extended
Data Fig. 10c, d) and at day 17 GFP1 fibroblasts were exclusively detected
immediately underneath the reformed epidermis (Fig. 4f and Extended
Data Fig. 10d).
We conclude that the first wave of dermal regeneration depends on
cells of the reticular dermis and hypodermis, which are not capable of
inducing hair follicles (Fig. 2i–k) and which elaborate the collagenous
1 2 D E C E M B E R 2 0 1 3 | VO L 5 0 4 | N AT U R E | 2 7 9
©2013 Macmillan Publishers Limited. All rights reserved
RESEARCH LETTER
Adult Injure
3/4 month
7 day
post-injured
harvest
Dlk1-CreER/ROSA-tdTomato
Lrig1
e
Tomato
Lrig1
f
tdTomato
Sca1
Itga8
Itga
DAPI
17 day post-injured
Dlk1-CreER/ROSA-tdTomato
g
Cre
eGFP
×
or
1 × 4OHT
or
>6 × 4OHT
βcatER
K14
l
Blimp1
×
CAG
Cre
eGFP
×
K14
βcatER
>6 × 4OHT
4OHT
treatment
Itga8
Sca1
24 days post wound
3 days
j
20
**
20
*
10
8 mm
wound
17/24 day
post-injured
analysis
GFP
Itga8
8
GFP
Itga8
1 × 4OHT
17 days post wound
***
**
***
4
2
0
1×
4OHT
Control
>6 ×
4OHT
30
>6 ×
4OHT
*
**
20
10
Control
>6 ×
4OHT
1×
4OHT
q
>6 ×
4OHT
K17
Itga8
GFP
Itga8
Itga8
Sca1
10
***
***
6
p
17 days post wound
20
Control 1 × >6 ×
>6 × 4OHT 4OHT
4OHT
Control 1 × >6 ×
>6 × 4OHT 4OHT
4OHT
0
24 days post wound
Lrig1
0!"
0 !"
Control 1 × >6 ×
>6 × 4OHT 4OHT
4OHT
Itga8
Sca1
1 × 4OHT
k
*
***
*
10
n
Control >6 × 4OHT
GFP
17 day post-injured
o
Stop
or
1 × 4OHT
or
>6 × 4OHT
m
Control >6 × 4OHT
GFP
Itg
Itgα8
i
Lrig1
7 day post-injured
0
Control
>6 × 4OHT
GFP
GFP
GFP
Sca1
Itga
Itga8
DAPI
GFP
Itga
Itga8
1 × 4OHT
Control >6 × 4OHT
17 day
post-injured
harvest
GFP
Sca1
Itga
Itga8
DAPI
Control
>6 × 4OHT
×
7 day
post-injured
harvest
Injure
Adult
3/4 month
eGFP
Lrig1+ (%)
Blimp1
CAG
Cre
Blimp1Cre/CAGCATeGFP
GFP
Itga
Itga8
h
×
Blimp1Cre/CAGCATeGFP
7 day post-injured
c
Blimp1
CAG
Tomato
tdTomato
Sca1
Itga8
Itga
DAPI
b
d
17 day
post-injured
harvest
Sca1+ (%)
E16.5
Tamoxifen
injection
Itga8+ (%)
CAG
CreER
×
tdTomato
Ectopic follicles
per 120 μm
Dlk1
Ectopic follicles
a
EF
>6 ×4OHT
24 days post wound
>6 × 4OHT
17 days post wound
>6 × 4OHT
24 days PW
Figure 4 | Contribution of fibroblast lineages in adult skin.
a, d, g, l, Labelling strategies. b, c, e, f, h, m, n, q, Histological analysis of
horizontal whole mounts. i–k, Flow-cytometric quantification of fibroblast
markers. o, p, Quantification of ectopic hair follicles in 17-day (o) and 24-day
wound bed whole-mount sections (p). n 5 3 (i–k) and n 5 6 (o, p) biological
replicates. *P , 0.05, **P , 0.005, ***P , 0.0005. Scale bars, 200 mm
(b, c, e, f), 100 mm (m, n, q) or 50 mm (higher magnification views). 4OHT,
tamoxifen.
ECM characteristic of fibrosis6. The upper dermal lineage is not repopulated until re-epithelialization and contributes exclusively to the
papillary dermis. This explains both the rapid reconstitution of the
skin adipocyte layer after wounding19 and the absence of hair follicles
in newly closed wounds20.
Sustained activation of the canonical Wnt pathway in adult epidermis induces growth of existing hair follicles (anagen), formation
of new hair follicles21,22, fibroblast proliferation and dermal ECM
remodelling8. To examine the impact on the different dermal lineages
we used K14DNb-cateninER transgenic mice. One application of
tamoxifen induces anagen, whereas repeated applications stimulate
ectopic hair follicle formation21. Epidermal b-catenin activation led
to expansion of the upper and lower dermal compartments, the effects
being more pronounced in mice that received multiple applications of
tamoxifen (Fig. 4h–k and Extended Data Fig. 10e–g). The relative
locations of the different dermal cells were unchanged (Extended
Data Fig. 9o, p). Expansion of the upper dermal lineage was evident
in K14DNb-cateninER x Blimp1-Cre/LSL-GFP mice (Fig. 4g, h). As
epidermal Wnt signalling promotes hair follicle growth, the expansion
of the lower dermis could explain why the skin adipocyte layer increases
in thickness during anagen22.
To test whether epidermal b-catenin activation before wounding
would promote hair follicle formation, K14DNb-cateninER/Blimp1Cre/LSL-GFP mice were given repeated applications of tamoxifen and
subsequently wounded (Fig. 4l). This led to increased numbers of
Itga81 and Lrig11 fibroblasts in the wound bed (Fig. 4m and Extended
Data Fig. 10h), an increased number of cells marked by Blimp1-Cre
(Fig. 4n) and a pronounced stimulation of hair follicle formation
(Fig. 4o–q). We conclude that dermal remodelling in response to epidermal b-catenin activation leads to expansion of the upper and lower
dermis, the increase in the upper papillary dermis being permissive for
new hair follicle formation. It will be interesting to identify the downstream signalling pathways involved, one candidate being Hedgehog21.
Wnt signalling regulates cells of the immune system23 and a role for
infiltrating cd T cells in promoting hair follicle formation has recently
been described24. The Wnt effector transcription factors Lef1 and Tcf3
were differentially expressed by upper and lower dermal fibroblasts
(Extended Data Fig. 5d, e), raising the intriguing possibility that different fibroblast lineages differ in their Wnt responsiveness and interactions with inflammatory cells24.
In conclusion, the lineage hierarchies we have described reveal the
cellular origins of the heterogeneous architecture of the dermis and
provide a mechanistic basis for understanding the changes that take
place during repair of adult skin wounds and in response to epidermal
Wnt activation. We now have the opportunity to uncover events that
result in dermal lineage specification, and discover how the different
lineages contribute to the changes that occur during ageing25 and
tumour formation1.
2 8 0 | N AT U R E | VO L 5 0 4 | 1 2 D E C E M B E R 2 0 1 3
©2013 Macmillan Publishers Limited. All rights reserved
LETTER RESEARCH
METHODS SUMMARY
The mouse lines, tamoxifen treatments, chamber grafting assay and bone marrow
transplantation experiments are described in the Methods26–30. Most experiments
were performed on female mice; however, the markers evaluated showed the same
distribution in males. 5-mm frozen sections and horizontal whole mounts11 were
prepared, stained and analysed as described in the Methods. Flow cytometry of
P2 disaggregated dermal preparations was performed as previously described11.
Antibodies for immunolabelling are listed in the Methods. RT–PCR was performed as previously described27. Analysis was performed by the delta-Ct method.
Primer probe sets were purchased from Applied Biosystems and used according to
manufacturer’s recommendations.
Online Content Any additional Methods, Extended Data display items and Source
Data are available in the online version of the paper; references unique to these
sections appear only in the online paper.
Received 23 February; accepted 15 October 2013.
1.
2.
3.
4.
5.
6.
7.
8.
9.
10.
11.
12.
13.
14.
15.
16.
Kalluri, R. & Zeisberg, M. Fibroblasts in cancer. Nature Rev. Cancer 6, 392–401
(2006).
Gurtner, G. C., Werner, S., Barrandon, Y. & Longaker, M. T. Wound repair and
regeneration. Nature 453, 314–321 (2008).
Martin, P. Wound healing–aiming for perfect skin regeneration. Science 276,
75–81 (1997).
Shah, M., Foreman, D. M. & Ferguson, M. W. Neutralising antibody to TGF-b1,2
reduces cutaneous scarring in adult rodents. J. Cell Sci. 107, 1137–1157 (1994).
Van Exan, R. J. & Hardy, M. H. The differentiation of the dermis in the laboratory
mouse. Am. J. Anat. 169, 149–164 (1984).
Dulauroy, S., Di Carlo, S. E., Langa, F., Eberl, G. & Peduto, L. Lineage tracing and
genetic ablation of ADAM121 perivascular cells identify a major source of
profibrotic cells during acute tissue injury. Nature Med. 18, 1262–1270 (2012).
Janson, D. G., Saintigny, G., van Adrichem, A., Mahe, C. & El Ghalbzouri, A. Different
gene expression patterns in human papillary and reticular fibroblasts. J. Invest.
Dermatol. 132, 2565–2572 (2012).
Collins, C. A., Kretzschmar, K. & Watt, F. M. Reprogramming adult dermis to a
neonatal state through epidermal activation of b-catenin. Development 138,
5189–5199 (2011).
Jensen, K. B., Driskell, R. R. & Watt, F. M. Assaying proliferation and differentiation
capacity of stem cells using disaggregated adult mouse epidermis. Nature
Protocols 5, 898–911 (2010).
Festa, E. et al. Adipocyte lineage cells contribute to the skin stem cell niche to drive
hair cycling. Cell 146, 761–771 (2011).
Driskell, R. R. et al. Clonal growth of dermal papilla cells in hydrogels reveals
intrinsic differences between Sox2-positive and -negative cells in vitro and in vivo.
J. Invest. Dermatol. 132, 1084–1093 (2012).
Lesko, M. H., Driskell, R. R., Kretzschmar, K., Goldie, S. J. & Watt, F. M. Sox2 modulates
the function of two distinct cell lineages in mouse skin. Dev. Biol. 382, 15–26 (2013).
Robertson, E. J. et al. Blimp1 regulates development of the posterior forelimb,
caudal pharyngeal arches, heart and sensory vibrissae in mice. Development 134,
4335–4345 (2007).
Horsley, V. et al. Blimp1 defines a progenitor population that governs cellular input
to the sebaceous gland. Cell 126, 597–609 (2006).
Magnúsdóttir, E. et al. Epidermal terminal differentiation depends on B
lymphocyte-induced maturation protein-1. Proc. Natl Acad. Sci. USA 104,
14988–14993 (2007).
Gomez, C. et al. The interfollicular epidermis of adult mouse tail comprises two
distinct cell lineages that are differentially regulated by Wnt, Edaradd, and Lrig1.
Stem Cell Reports 1, 19–27 (2013).
17. Page, M. E., Lombard, P., Ng, F., Gottgens, B. & Jensen, K. B. The epidermis
comprises autonomous compartments maintained by distinct stem cell
populations. Cell Stem Cell 13, 471–482 (2013).
18. Egawa, G., Osawa, M., Uemura, A., Miyachi, Y. & Nishikawa, S. Transient expression
of ephrin b2 in perinatal skin is required for maintenance of keratinocyte
homeostasis. J. Invest. Dermatol. 129, 2386–2395 (2009).
19. Schmidt, B. A. & Horsley, V. Intradermal adipocytes mediate fibroblast recruitment
during skin wound healing. Development 140, 1517–1527 (2013).
20. Ito, M. et al. Wnt-dependent de novo hair follicle regeneration in adult mouse skin
after wounding. Nature 447, 316–320 (2007).
21. Silva-Vargas, V. et al. b-catenin and Hedgehog signal strength can specify number
and location of hair follicles in adult epidermis without recruitment of bulge stem
cells. Dev. Cell 9, 121–131 (2005).
22. Plikus, M. V. et al. Cyclic dermal BMP signalling regulates stem cell activation
during hair regeneration. Nature 451, 340–344 (2008).
23. Staal, F. J., Luis, T. C. & Tiemessen, M. M. WNT signalling in the immune system:
WNT is spreading its wings. Nature Rev. Immunol. 8, 581–593 (2008).
24. Gay, D. et al. Fgf9 from dermal cd T cells induces hair follicle neogenesis after
wounding. Nature Med. 19, 916–923 (2013).
25. Giangreco, A., Qin, M., Pintar, J. E. & Watt, F. M. Epidermal stem cells are retained
in vivo throughout skin aging. Aging Cell 7, 250–259 (2008).
26. Arwert, E. N. et al. Tumor formation initiated by nondividing epidermal cells via an
inflammatory infiltrate. Proc. Natl Acad. Sci. USA 107, 19903–19908 (2010).
27. Driskell, R. R., Giangreco, A., Jensen, K. B., Mulder, K. W. & Watt, F. M. Sox2-positive
dermal papilla cells specify hair follicle type in mammalian epidermis.
Development 136, 2815–2823 (2009).
28. Rivers, L. E. et al. PDGFRA/NG2 glia generate myelinating oligodendrocytes
and piriform projection neurons in adult mice. Nature Neurosci. 11, 1392–1401
(2008).
29. Kawamoto, S. et al. A novel reporter mouse strain that expresses enhanced green
fluorescent protein upon Cre-mediated recombination. FEBS Lett. 470, 263–268
(2000).
30. Hamilton, T. G., Klinghoffer, R. A., Corrin, P. D. & Soriano, P. Evolutionary divergence
of platelet-derived growth factor alpha receptor signaling mechanisms. Mol. Cell.
Biol. 23, 4013–4025 (2003).
Supplementary Information is available in the online version of the paper.
Acknowledgements This work was funded by the Wellcome Trust (F.M.W., A.C.F.-S.),
the Medical Research Council (MRC) (F.M.W., A.C.F.-S.) and the European Union FP7
programme: TUMIC (F.M.W.), HEALING (F.M.W.) and EpigeneSys (A.C.F.-S.). B.M.L. is
the recipient of a FEBS long-term fellowship. K.K. is the recipient of a MRC PhD
Studentship. The authors acknowledge financial support from the Department of
Health via the National Institute for Health Research (NIHR) comprehensive Biomedical
Research Centre award to Guy’s & St Thomas’ NHS Foundation Trust in partnership
with King’s College London (KCL) and King’s College Hospital NHS Foundation
Trust. Input from M. Mastrogiannaki, A. Reimer and B. Trappmann is gratefully
acknowledged. The authors also thank J. Connelly and G. Theocharidis for providing
tissue, KCL core staff, in particular J. Castle, C. Pearce and D. Cooper, for technical
support, and J. Harris and the Nikon Imaging Centre at KCL for expert assistance.
Author Contributions R.R.D. and F.M.W. designed the experiments, performed data
analysis, interpreted the results and wrote the manuscript. B.M.L., E.H., K.K., A.C.F.-S.,
S.R.F., B.D.S. and M.C. assisted in performing and designing experiments, analysing
data and interpreting results. Y.H. and G.P. generated the Dlk1-CreER transgenic
mouse.
Author Information Reprints and permissions information is available at
www.nature.com/reprints. The authors declare no competing financial interests.
Readers are welcome to comment on the online version of the paper. Correspondence
and requests for materials should be addressed to F.M.W. (fiona.watt@kcl.ac.uk).
1 2 D E C E M B E R 2 0 1 3 | VO L 5 0 4 | N AT U R E | 2 8 1
©2013 Macmillan Publishers Limited. All rights reserved
RESEARCH LETTER
METHODS
Transgenic mice. Mice were maintained on a C57/Blk6 and CBA F1 background.
Pdgfr-a-CreER28 or Dlk1-CreERt (ICS) mice were bred with CAG-CAT-eGFP29
(LSL-GFP) or ROSA26-tdTomato (Jackson Laboratory, 007905) (LSL-tdTomato).
Pdgfr-a-H2B–eGFP mice30 were obtained from Jackson Laboratories. Blimp1–
GFP14 and Blimp1-Cre (Jackson Laboratory, 008827)13 mice have been described
previously. K14DNb-cateninER mice have previously been described. Tamoxifen
(Sigma-Aldrich) was injected intraperitoneally into adult mice. 2 mg of tamoxifen
in 100 ml of acetone was administered topically to the back skin of pups. Bone
marrow reconstitution experiments and wounding (8-mm diameter full-thickness
wounds) were performed as described previously26. All experiments were performed according to the guidelines of the UK Government Animals (Scientific
Procedures) Act 1986 and underwent ethical review by Cambridge University and
King’s College London. Experiments were typically performed on female mice;
however, the markers evaluated showed the same distribution in males. All experiments were performed on three or more female mice.
Flow cytometry. P2 disaggregated dermal preparations were prepared as previously described11 and labelled with the antibodies listed below.
RT–PCR. This was performed as previously described27. Analysis was performed
by the delta-Ct method. Primer probe sets were purchased from Applied Biosystems
and used according to manufacturer’s recommendations: Sca1, Mm00726565_s1;
Dlk1, Mm00438422_m1; CD26, Mm00494538_m1; Pparg, Mm01184322_m1;
Zfp423, Mm00473699_m1; Acta2, Mm01546133_m1; Axin2, Mm01266783_m1;
Dkk1, Mm00438422_m1; Lef1, MM01310389_m1; Tcf3, Mm01188714_m1; Tcf7l2,
Mm00501505_m1; Wnt5a, Mm00437347_m1; Blimp1, Mm01187285_m1.
Chamber grafting assay. This procedure was performed as described previously9.
8 3 106 wild-type adult dorsal epidermal cells were combined with 5 3 106 wildtype P2 dermal cells and 105 flow-sorted Pdgfr-a-H2B–eGFP P2 dermal cells.
Histology and microscopy. 5-mm frozen sections and horizontal whole mounts
were stained with the antibodies listed. The tissue array (Fig. 1c) was constructed
from digitally excised images of areas of upper and lower dermis (Fig. 1b). All
microscopy was performed on a Leica SP5 or Nikon A1 confocal microscope and
images were analysed in Image J and Adobe Photoshop CS6.
Horizontal whole mounts were prepared as described previously11. Skin was
collected and fixed in 4% paraformaldehyde for 15–30 min then embedded in
cryomolds. Sections were cut on a cryostat at a thickness of between 50–150 mm.
Instead of attaching sections with OCT onto slides, forceps were used to place
sections into 1 3 PBS at room temperature (,22 uC). The 1 3 PBS dissolved away
the OCT and tissue was then ready for staining in 300–500 ml of PB buffer (1 3 PBS
containing 0.5% skimmed milk, 0.25% cold water fish skin gelatin, 0.5% Triton
X-100) in Eppendorf tubes. Sections could be stored for 3–6 months in 1 3 PBS at
4 uC. Staining is subsequently performed by incubation with primary antibody
overnight at 4 uC on a rocker. Secondary antibodies were incubated for at least
2 h at room temperature after one wash in 1 3 PBS for 1 h. The tissue was then
mounted on coverslips with a small volume of 100% glycerol and analysed by
confocal microscopy.
Antibodies. The following antibodies were used: Itga8 (R&D Systems AF4076),
Dlk1 (R&D Systems AF1144), CD26 (R&D Systems AF954), Sca1 (R&D Systems
AF1226), Pdgfr-a (R&D Systems AF1062), Fabp4 (R&D Systems AF1443), Adipoq
(R&D Systems AF1119), Ephb3 (R&D Systems AF432), Lrig1 (R&D Systems
AF3688), podoplanin (R&D Systems AF3244), transglutaminase 2 (R&D Systems
AF4376), Blimp1 (eBioscience 14-5963), CD26 (eBioscience 45-0261), Sca1 (eBioscience 56-5981-82), Pdgfr-a (eBioscience 14-140182), E-cadherin (eBioscience
17-1449), CD34 (eBioscience 17-0349-42), CD44 (eBioscience 130441), CD45 (eBioscience 12-0451), CD31 (eBioscience 25-0311-82), GFP (Invitrogen A11122),
LipidTOX (Invitrogen H34476), tdTomato (Rockland 600-401-379), Dlk1 (MBL
D187-5), ColIV (Millipore AB8201), Lef1 (Cell Signaling 2330S), vimentin (Cell
Signaling 5741S). The a-smooth muscle actin antibody was a gift from F. Nestle,
King’s College London.
Clonal growth of fibroblast subpopulations in hydrogels. Flow-sorted Pdgfr-a
populations were seeded into Extracel hydrogels (Glycosan Biosystems), which
contain crosslinked gelatin and hyaluronic acid11, in individual wells of 24-well
plates at a density of 5 3 104 cells per well. Cells were grown in Adipogenic Medium
(R&D Systems) or standard growth medium (DMEM supplemented with 10%
bovine serum) for 1 week. Cultures were fixed with 4% paraformaldehyde, washed
in PBS and stained with LipidTOX (Invitrogen 1:500) and DAPI. Spheres were
scored positive for adipogenesis if they contained at least one lipid-positive cell.
Graphing and statistical analysis. All graphs were generated using Excel, GraphPad
Prism 6 and Adobe Illustrator CS4 software. Data are means 6 standard error of
the mean (s.e.m.). A one-way ANOVA parametric test was performed for experiments, with P , 0.05 considered significant.
Sample size for animal experiments was determined on the basis of pilot experiments.
In the case of the skin reconstitution assays, animals were excluded from analysis
only if grafts were unsuccessful (that is, chamber falling out 1–2 days after grafting).
©2013 Macmillan Publishers Limited. All rights reserved
LETTER RESEARCH
Extended Data Figure 1 | Expression of panel of markers during back skin
development. Sections were counterstained with DAPI (blue). Scale bars,
50 mm. Photomicrographs of 10-mm-thick sections are representative of three
biological replicates.
©2013 Macmillan Publishers Limited. All rights reserved
RESEARCH LETTER
Extended Data Figure 2 | Expression of markers during back skin
development. a, Expression of additional markers. Counterstained with DAPI
(blue). b, Co-expression of CD31, CD45, CD26, Dlk1 and Sca1. Counterstained
with DAPI (blue). Scale bars, 50 mm. Photomicrographs of 10-mm-thick
sections are representative of three biological replicates.
©2013 Macmillan Publishers Limited. All rights reserved
LETTER RESEARCH
Extended Data Figure 3 | Isolation and in vitro properties of dermal
subpopulations. a–c, Flow cytometry of E12.5, E14.5, E16.5 and P2 Pdgfr-aH2B–eGFP mouse dermal cells labelled with antibodies to CD26 (a), Dlk1 (b)
and Sca1 (c). Graphs show average percentage of cells that co-express
individual markers and GFP. Data from three biological replicates at each time
point. d–g, Clonal growth of fibroblast subpopulations from E16.5 (d, e) and
P2 (f, g) dermis. d, f, Representative phase contrast and LipidTOX fluorescent
images of clones encapsulated in hydrogels and cultured in DMEM plus 10%
bovine serum or adipogenic differentiation medium. e, g, Quantification of
lipid-positive colonies. n 5 3 biological replicates. One-way ANOVA
parametric tests of significance were used to determine P values: *P , 0.05;
**P , 0.005; ***P , 0.0005. Error bars are 6 s.e.m. Scale bars, 10 mm.
©2013 Macmillan Publishers Limited. All rights reserved
RESEARCH LETTER
Extended Data Figure 4 | Fibroblast marker expression in human skin.
a, c, e–h, Neonatal human foreskin. b, d, Adult human abdomen. a, b, PDGFRa was detected in mesenchymal (vimentin1) cells throughout the dermis.
DLK1 (c, d, f), CD26 (e, g) and PDPN (h) were differentially expressed in upper
(CD26) or lower (DLK1, PDPN) neonatal dermis. DLK1 was not expressed by
adult dermal fibroblasts (d). Scale bars, 50 mm. n 5 2 biological replicates.
©2013 Macmillan Publishers Limited. All rights reserved
LETTER RESEARCH
Extended Data Figure 5 | Further characterization of P2 mouse dermal
fibroblast subpopulations. a, b, 10-mm sections of P2 skin stained for markers
indicated, with DAPI counterstain (white). c, Flow-sorting strategy to isolate
cells from P2 papillary dermis (CD261 Sca12), reticular/hypodermis (Dlk11/
Sca12) and hypodermis (Dlk11 Sca11 and Dlk12 Sca11). d, Heat map of
relative messenger RNA levels of the genes indicated that are represented in
histograms, summarizing data in e. e, Characterization of flow-sorted
fibroblasts from P2 dermis. Relative mRNA levels of the genes indicated,
normalized to Gapdh. Data are means of three biological replicates (6 s.e.m.).
One-way ANOVA parametric tests of significance were used to determine
P values: *P , 0.05; **P , 0.005; ***P , 0.0005. f–i, Preadipocyte precursors
(Lin2 CD341 CD291 Sca11) express Pdgfr-a. Single-cell suspension of P2
Pdgfr-a-H2B–eGFP mouse dermis was gated for Lin2 (f), CD291 CD341 (g),
Sca11 (h) and GFP1 (i). Scale bars, 50 mm. All data are representative of three
biological replicates.
©2013 Macmillan Publishers Limited. All rights reserved
RESEARCH LETTER
Extended Data Figure 6 | Skin reconstitution with different fibroblast
subpopulations. a–i, See Fig. 2a for experimental set-up. a–d, Horizontal
whole-mount micrographs of grafts immunostained for eGFP and LipidTOX
with DAPI counterstain (blue). Boundary between dermis and hypodermis/
adipocytes is indicated by dotted line. e–h, Representative macroscopic views of
skin grafts. i, Number of hair follicles per graft. Error bars are 6 s.e.m. n 5 4
grafts per fibroblast population. One-way ANOVA parametric tests were used
to determine significance. *P , 0.05. Scale bars, 100 mm (a–d) and 400 mm
(e–h). j–l, Representative flow-cytometry plots from exclusion sorts of Pdgfr-aH2B–eGFP dermis for grafting assays in Fig. 2g, k. j, Positive control: all dermal
cells collected. k, No reticular/hypodermis: Dlk11 and Sca11 cells were not
collected. l, No papillary/reticular dermal sorts: Dlk1 Sca12 and CD261 Sca12
cells were not collected.
©2013 Macmillan Publishers Limited. All rights reserved
LETTER RESEARCH
Extended Data Figure 7 | Lineage tracing controls. a, Dlk1-CreER and LSLtdTomato mice were bred and at 16.5 days of gestation were injected with
5 mg ml21 tamoxifen in corn oil. b, c, Embryos were collected at E17.5 and
single-cell suspensions of labelled embryonic dermis were analysed for
overlapping tdTomato expression and endogenous Dlk1 expression.
b, Representative flow cytometry plot. c, Graph is representative of n 5 4
embryos. Error bars are s.e.m. d–g, Blimp1 expression in embryonic and
postnatal skin of wild-type (d) and Blimp1–GFP (e–g) mice. Horizontal whole
mounts were stained for endogenous Blimp1 (d, f), CD26 (e) and
Itga8 (g). h, i, Horizontal whole mounts of Bimp1–GFP (h) and Blimp1-Cre/
LSL-GFP (i) skin co-stained for CD31. j, k, E18.5 single-cell suspensions of
Blimp1–GFP (j) and Blimp1-Cre/LSL-GFP (k) cells labelled with CD26.
l, Experimental approach for Lrig1-CreER labelling of papillary dermis.
m, Horizontal whole-mount stain of Lrig1-CreER/LSL-tdTomato mouse skin
labelled at E16.5 and collected at P2. n–p, Flow-cytometric analysis of labelling
specificity of tdTomato compared to Lrig1 (n), Pdgfr-a (o) and Sca1
(p). q, Flow-cytometric analysis of overlapping expression of Lrig1–GFP with
CD26. Data are representative of three biological replicates. Scale bars, 100 mm.
©2013 Macmillan Publishers Limited. All rights reserved
RESEARCH LETTER
Extended Data Figure 8 | Clonal analysis of papillary dermis.
a, Experimental strategy and flow cytometry of dermal cells isolated from mice
treated with increasing concentrations of tamoxifen. b, Percentage of Pdgfr-a1
cells 4 days after treatment with different concentrations of tamoxifen (n 5 7
per concentration). 25 mg g21 tamoxifen resulted in less than 1% of fibroblasts
being labelled. c, d, Whole-mount analysis of GFP-labelled cells in
E16.5 skin. e, f, j, Histological analysis of the fate of papillary clones from
Pdgfr-a-CreER 3 LSL-GFP mice injected with 25 mg g21 tamoxifen at E12.5
and harvested at P2 (e), P10 (j) and P21 (f). g–i, Quantification of the fate of
papillary fibroblast clones derived from E12.5 embryonic mesenchyme.
g, Number of cells per clone. h, i, Number of cells per cross-compartmental
clone of papillary and arrector pili cells (h) and pure arrector pili cells (i). n 5 3
biological replicates (6 s.e.m.). Scale bars, 50 mm. One-way ANOVA
parametric tests were used to test for significance. ***P , 0.0005.
©2013 Macmillan Publishers Limited. All rights reserved
LETTER RESEARCH
Extended Data Figure 9 | Bone marrow transplantation, wound healing and
b-catenin activation. a–k, Bone marrow (BM) reconstitution experiments.
a, Schematic representation of the experiments. Bone marrow of mice that
express eGFP under the control of the CAG promoter (b-actin CMV promoter
(ACP)–GFP)) or Pdgfr-a-H2B–eGFP mice was transplanted into sublethally
irradiated wild-type mice. One month later, 8-mm diameter full-thickness
circular wounds were made in the back skin with a biopsy punch. Skin was
analysed 5 and 10 days after wounding. b, c, Y chromosome staining of
reconstituted spleen from ACP–GFP (b) and Pdgfr-a-H2B–eGFP mice
(c). d, e, Horizontal whole mounts of wild-type mouse back skin reconstituted
with bone marrow from ACP–GFP (d) or Pdgfr-a-H2B–eGFP (e) mice, stained
for GFP and Pdgfr-a with DAPI counterstain (blue). f–i, Horizontal whole
mounts of wild-type mouse back skin reconstituted with bone marrow from
ACP–GFP (f, h) and Pdgfr-a-H2B–eGFP (g, i) mice 5 (f, g) and 10 (h, i) days
after wounding, stained for GFP and Pdgfr-a with DAPI counterstain (blue).
Arrows indicate wounded regions of skin. Scale bars, 40 mm (b, c), 100 mm
(d–i). j, k, Flow cytometry of GFP1 dermal cells. j, representative plots.
k, Quantification of GFP1 cells. ACP–GFP, n 5 6 biological replicates; Pdgfra-H2B–eGFP, n 5 5 biological replicates. One-way ANOVA parametric tests
were used to test for significance. ***P , 0.0005. l–p, Fibroblast responses to
wounding and epidermal b-catenin activation. l–n, Fibroblast lineages during
full thickness wound repair. Pdgfr-a-CreER/LSL-tdTomato lineage tracing was
performed as indicated (l) and wound beds were stained for tdTomato (green)
and Lrig1 (red) (m, n). Scale bars, 150 and 50 mm. Micrographs are
representative of n 5 3 female biological replicates. o, p, Experimental strategy
(o) and histological analysis (p) of wild-type and K14DNb-cateninER
transgenic mice co-stained with Itga8 (green) and Sca1 (red). n 5 3 biological
replicates. Scale bars, 100 mm. Number of tamoxifen (4OHT) treatments is
indicated.
©2013 Macmillan Publishers Limited. All rights reserved
RESEARCH LETTER
Extended Data Figure 10 | Fibroblast lineages during full thickness wound
repair. a–d, Dlk1-CreER/LSL-tdTomato (a, b) and Blimp1/LSL-GFP (c, d)
lineage tracing was performed as indicated (a, c) and wound beds were
stained for PDGFRa, Itga8, Acta2, CD45 and CD31. Scale bars, 50 mm.
Micrographs are representative of n 5 3 female biological replicates.
e–g, Quantitative analysis of single-cell suspensions of Pdgfr-a-H2B–eGFP
single (control) and K14DNb-cateninER/Pdgfr-a-H2B–eGFP doubletransgenic mice co-stained with Lrig1-PE (e) or Itga8-APC (f) or Sca1-PE
(g). n 5 3 biological replicates. h, Horizontal whole mounts of control and
K14bcatER skin immunstained for Lrig1 (green) and Sca1 (red). n 5 6 female
biological replicates. Scale bars, 100 mm. Number of tamoxifen (4OHT)
treatments is indicated.
©2013 Macmillan Publishers Limited. All rights reserved

