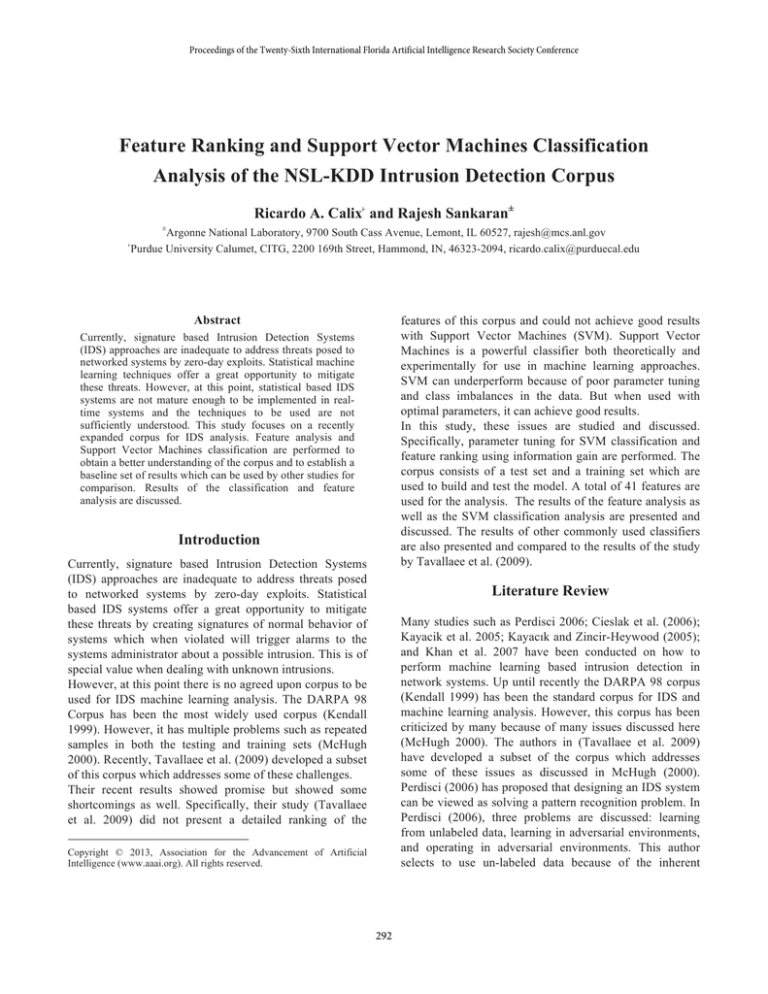
Proceedings of the Twenty-Sixth International Florida Artificial Intelligence Research Society Conference
Feature Ranking and Support Vector Machines Classification
Analysis of the NSL-KDD Intrusion Detection Corpus
Ricardo A. Calix˫ and Rajesh Sankaran±
±
˫
Argonne National Laboratory, 9700 South Cass Avenue, Lemont, IL 60527, rajesh@mcs.anl.gov
Purdue University Calumet, CITG, 2200 169th Street, Hammond, IN, 46323-2094, ricardo.calix@purduecal.edu
Abstract
features of this corpus and could not achieve good results
with Support Vector Machines (SVM). Support Vector
Machines is a powerful classifier both theoretically and
experimentally for use in machine learning approaches.
SVM can underperform because of poor parameter tuning
and class imbalances in the data. But when used with
optimal parameters, it can achieve good results.
In this study, these issues are studied and discussed.
Specifically, parameter tuning for SVM classification and
feature ranking using information gain are performed. The
corpus consists of a test set and a training set which are
used to build and test the model. A total of 41 features are
used for the analysis. The results of the feature analysis as
well as the SVM classification analysis are presented and
discussed. The results of other commonly used classifiers
are also presented and compared to the results of the study
by Tavallaee et al. (2009).
Currently, signature based Intrusion Detection Systems
(IDS) approaches are inadequate to address threats posed to
networked systems by zero-day exploits. Statistical machine
learning techniques offer a great opportunity to mitigate
these threats. However, at this point, statistical based IDS
systems are not mature enough to be implemented in realtime systems and the techniques to be used are not
sufficiently understood. This study focuses on a recently
expanded corpus for IDS analysis. Feature analysis and
Support Vector Machines classification are performed to
obtain a better understanding of the corpus and to establish a
baseline set of results which can be used by other studies for
comparison. Results of the classification and feature
analysis are discussed.
Introduction
Currently, signature based Intrusion Detection Systems
(IDS) approaches are inadequate to address threats posed
to networked systems by zero-day exploits. Statistical
based IDS systems offer a great opportunity to mitigate
these threats by creating signatures of normal behavior of
systems which when violated will trigger alarms to the
systems administrator about a possible intrusion. This is of
special value when dealing with unknown intrusions.
However, at this point there is no agreed upon corpus to be
used for IDS machine learning analysis. The DARPA 98
Corpus has been the most widely used corpus (Kendall
1999). However, it has multiple problems such as repeated
samples in both the testing and training sets (McHugh
2000). Recently, Tavallaee et al. (2009) developed a subset
of this corpus which addresses some of these challenges.
Their recent results showed promise but showed some
shortcomings as well. Specifically, their study (Tavallaee
et al. 2009) did not present a detailed ranking of the
Literature Review
Many studies such as Perdisci 2006; Cieslak et al. (2006);
Kayacik et al. 2005; Kayacık and Zincir-Heywood (2005);
and Khan et al. 2007 have been conducted on how to
perform machine learning based intrusion detection in
network systems. Up until recently the DARPA 98 corpus
(Kendall 1999) has been the standard corpus for IDS and
machine learning analysis. However, this corpus has been
criticized by many because of many issues discussed here
(McHugh 2000). The authors in (Tavallaee et al. 2009)
have developed a subset of the corpus which addresses
some of these issues as discussed in McHugh (2000).
Perdisci (2006) has proposed that designing an IDS system
can be viewed as solving a pattern recognition problem. In
Perdisci (2006), three problems are discussed: learning
from unlabeled data, learning in adversarial environments,
and operating in adversarial environments. This author
selects to use un-labeled data because of the inherent
Copyright © 2013, Association for the Advancement of Artificial
Intelligence (www.aaai.org). All rights reserved.
292
challenges in obtaining reliable annotated network data for
IDS pattern classification. Perdisci (2006) used a modular
multiple classifier system with an un-labeled data set to
detect anomalies that threaten a computer network system.
The results of their study showed that this approach can
improve accuracy when compared to other “monolithic”
approaches. In Cieslak et al. (2006), the authors address the
issue of class imbalance which is a well-known problem in
machine learning which can affect classification results.
They used SNORT to create a data set of imbalanced IDS
data. Their approach using oversampling and undersampling helps to improve their results.
An important study related to feature analysis of IDS data
for machine learning analysis is Kayacik et al. (2005). In
their work, these authors used information gain to rank the
features of the original Darpa 98 Corpus. Their analysis
includes the ranking of features based on individual types
of connection such as NMAP scanning, Smurf attack, or
FTP connection. The work proposed in this paper will also
use information gain ranking for the sake of comparison.
This comparison will help to understand if the feature
ranking of the NSL-KDD corpus is consistent with the
ranking of the Darpa 98 corpus. Kayacık and ZincirHeywood (2005) also used the DARPA 98 corpus but
compared it to their own synthetic corpus. They used
clustering and artificial neural networks to perform the
analysis. Their main critique was that their dataset appears
to be more realistic than the DARPA 98 original data set.
Further discussion of these issues can be seen in McHugh
(2000). Methods such as Support Vector Machines are
consistently the best at classification problems and in
pattern recognition. In the study of Khan et al. (2007),
SVM was used for intrusion detection. The results of their
study found that SVM achieved good classification
accuracies on the DARPA 98 Corpus.
Intrusion Detection Systems refer to a technology used for
detection of abnormal behavior in networked systems that
threaten confidentiality, integrity, and availability of
resources. Currently, IDS systems are mostly implemented
as signature based approaches. The basic mechanism is to
have rules which are used to detect malicious signatures in
a connection. One of the most widely used intrusion
detection systems is SNORT (Roesch, M. 1999). Snort
uses heuristic rules to identify malware or intrusion
attempts. This approach, however, requires prior
knowledge to craft the intrusion patterns which is the
downside of snort and other IDS systems when applied to
unknown exploits. It can be used on host computers, or
downloaded on open source routers such as
PackerProtector. Enterprise routers such as CISCO IDS
sensors also employ the same mechanism of downloading
the signature off the web. One key issue with these devices
is that they have limited memory and processing power.
Enterprise sensors are by far the devices with the most
memory and processing power. However, it is well known
that machine learning techniques require large data sets to
train the models and can require a lot of processing power.
Therefore, finding more efficient machine learning
techniques is essential. Support Vector machines is a
technique introduced by Cortes and Vapnik (1995) which
tries to maximize the margin that separates data from two
different classes. It is based on statistical learning theory.
The objective is to minimize empirical and structural risk.
It minimizes empirical risk by the minimization of the
squared errors (the Ei term) and it minimizes structural risk
my minimizing the weight vector. In this study, LibSVM
(Chang and Lin 2001) in conjunction with WEKA were
used to train and test the model.
Methodology
In this paper a methodology for feature ranking and
classification analysis using Support Vector Machines is
presented and discussed. To perform optimal classification
analysis, a grid search is used on the training set to obtain
optimal parameter for use with the SVM Radial Basis
Function (RBF) kernel. After optimal parameters are
determined, that SVM model is trained and tested and the
results are discussed.
Following this step, feature ranking is performed using
information gain feature ranking. With a reduced set of
features, the classification using SVM is repeated and the
results are discussed. Finally, the data set is analyzed using
several other classification techniques including those
discussed by (Tavallaee et al. 2009) and some that were
not previously performed. It is hoped that this paper will
serve as a baseline work for future machine learning based
studies on the KDD–NLS corpus (Tavallaee et al. 2009).
To deal with non-linear data, a kernel trick is used to map
non-linear data to higher dimensional linear space.
Common kernels include linear, radial basis function
(RBF), polynomial kernels, and sigmoidal. The SVM
classifier is normalized and uses an RBF kernel for optimal
results.
A set of 41 features was used for the analysis. These
features are grouped into 3 main areas depending on how
the information is extracted from the connection (Tavallaee
et al. 2009). The first group consists of features where the
information is extracted from the parameters that identify
the TCP/IP connection. The second group takes a current
connection’s characteristics and compares it to that of
previous connections given a window of time. Behavior in
ports and services is compared. The third group of features
focuses on strange behavior such as too many failed login
attempts. A more detailed description of these features and
how they are extracted can be obtained in (Tavallaee et al.
2009). Feature analysis is performed using Information
293
Table 3 – Classification Analysis
Gain feature ranking (Yang and Pederson 1997). This
analysis was performed in Weka and the cut-off was
manually set to all features with an information gain value
greater than 0.14. Once the features are ranked,
classification was performed using a reduced set of
features to see if classification accuracy is degraded.
Analysis and Results
Analysis
F-measure
Normal
F-measure
Anomaly
SVM (RBF)
Train:
KDDTrain+_20%
Test: KDDTest+
SVM (RBF)
Train:
KDDTrain+_20%
Test: KDDTest-21
0.778
0.361
F-measure
Anomaly
F-Measure
Weighted
Average
Naïve Bayes
Decision Trees
(J48)
Random Forests
Nearest Neighbor
(IB1)
Multilayer
Perceptron
SVM (RBF)
0.771
0.819
0.751
0.811
0.759
0.815
Normal
Note:
0.772
0.786
0.777
0.792
0.8067
N/A
0.779
0.766
0.772
0.7741
0.777
0.764
0.77
0.6952
Results of the confusion matrix analysis with Train and test
sets Train+ and Test+ (from Tavallaee et al. 2009) can be
seen in Table 2. These results show that, in general, the
model tends to misclassify anomalous samples more often
than normal samples. As a result, the system tends to have
more false negatives. This result indicates dangerous
samples are being allowed through which is not something
that is desired. Therefore, more features related to attacks
may be needed to improve the detection scheme.
709
Normal
8371
Anomaly
712
Normal
4394
5304
Anomaly
Precision
Recall
F-measure
Normal
0.669
0.927
0.777
Anomaly
0.922
0.625
0.764
Weighted Avg.
0.813
0.771
0.77
Rank
1
2
3
4
5
6
7
8
9
10
11
12
13
14
15
Anomaly
4462
Anomaly
1440
Table 6 – Feature Analysis
Table 2 – Confusion Matrix
9002
0.4229
Overall, from the results in Tables 1, 2, 3, 4, it seems that
the model was able to learn and achieved good prediction
results. The SVM F-measure, precision and recall scores
using the Train+ and Test+ datasets from the NSL-KDD
corpus for the Support Vector Machines classifier using an
RBF kernel can be seen in Table 5. To gain a better
understanding of the features, feature selection using the
information gain technique and a ranker was performed.
The results of the feature selection can be seen in Table 6.
Train and test sets used here are: KDDTrain+ and KDDTest+
Normal
0.618
Table 5 – Classification Analysis
From
Tavallaee et
al. (2009) –
KDDTest+
0.7656
0.8105
0.783
0.801
0.675
Table 4 – Confusion Matrix
Table 1 – Classification Analysis
F-measure
Normal
From
Tavallaee et
al. (2009)
0.6952
The confusion matrix using the train set Train+_20Percent
and test set Test-21 (from Tavallaee et al. 2009) can be
seen in Table 4. This confusion matrix seems to have a
higher percentage of false positives when compared to
Table 2.
To provide additional statistics about the data sets, several
classifiers were trained and tested using the Train+ and
Test+ datasets from the NSL-KDD corpus as can be seen
on Table 1. Table 3 presents an SVM analysis using the
KDDTrain+_20Percent set for training purposes and both
the KDDTest+ and KDDTest-21 sets for testing purposes.
This analysis was done with the Support Vector Machines
techniques with an RBF kernel and parameters gamma
equal 0.03125 and cost equal 8.
Analysis
0.767
F-Measure
Weighted
Average
0.772
The SVM results in Table 3 when compared to the results
from the study in Tavallaee et al. (2009) appear to have
some improvement. This may be due to the RBF kernel
and the search grid for parameter tuning which yielded
optimal parameters. After performing parameter tuning
using the Radial Basis Function (RBF) kernel, the optimal
parameters that were obtained are: gamma (g) equal to
0.03125 and cost (C) equal to 8.
294
Value
0.8162
0.6715
0.6330
0.5193
0.5186
0.5098
0.4759
0.4382
0.4109
0.4059
0.4047
0.3980
0.3927
0.3835
0.3791
Feature
Src_bytes
Service
Dst_bytes
flag
Diff_srv_rate
Same_srv_rate
Dst_host_srv_count
Dst_host_same_srv_rate
Dst_host_diff_srv_rate
Dst_host_serror_rate
Logged_in
Dst_host_srv_serror_rate
Serror_rate
count
Srv_serror_rate
SVM Detailed Analysis
classification analysis such as with Hidden Markov Models
(HMMs). HMMs can prove to be very useful for this type
of analysis because they help to capture knowledge about
prior states and how this information can help to predict
future outcomes. Additionally, the study of new specific
kernels which can be derived automatically will also be
explored.
One of the objectives of this study is to perform a more
detailed analysis of this corpus using the Support Vector
Machines classifier. Therefore, classification using
different kernels was performed. The kernels used included
radial basis function (RBF), linear kernel, polynomial
kernel, and the sigmoidal kernel.
Table 7 – Kernel Method Comparison
Kernel
Linear
Polynomial
RBF
Sigmoidal
F-measure
Normal
0.786
N/A
0.777
0.707
F-measure
Anomaly
0.756
N/A
0.764
0.685
References
F-Measure
W. Avg.
0.769
N/A
0.77
0.694
Chang, C.-C., Lin, C. 2001. LIBSVM: a library for support vector
machines. Retrieved from
http://www.csie.ntu.edu.tw/~cjlin/libsvm.
Cieslak, D.A.; Chawla, N.V.; Striegel, A. 2006. Combating
imbalance in network intrusion datasets. IEEE International
Conference on Granular Computing, 10-12, pp.732 - 737
Cortes, C., Vapnik, V. 1995. Support-Vector Networks. Machine
Learning, vol. 20, pp. 273-297.
Kayacik, H. G., Zincir-Heywood, A. N., & Heywood, M. I. 2005.
Selecting features for intrusion detection: A feature relevance
analysis on kdd 99 intrusion detection datasets. In Proceedings of
the Third Annual Conference on Privacy, Security and Trust
(PST-2005).
Kayacık, G.; Zincir-Heywood, N. 2005. Analysis of three
intrusion detection system benchmark datasets using machine
learning algorithms. In Proceedings of the 2005 IEEE
international conference on Intelligence and Security Informatics
(ISI'05), Paul Kantor, Gheorghe Muresan, Fred Roberts, Daniel
D. Zeng, and Fei-Yue Wang (Eds.). Springer-Verlag, Berlin,
Heidelberg, 362-367. DOI=10.1007/11427995_29
http://dx.doi.org/10.1007/11427995_29
Kendall, K. 1999. A database of computer attacks for the
evaluation of intrusion detection systems. Proceedings DARPA
Information Survivability Conference and Exposition (DISCEX),
MIT Press, pp: 12-26.
Khan, L,; Awad. M.; Thuraisingham, B. 2007. A new intrusion
detection system using support vector machines and hierarchical
clustering. The VLDB Journal. DOI 10.1007/s00778-006-0002-5
McHugh J. 2000. Testing Intrusion Detection Systems: A
Critique of the 1998 and 1999 DARPA Intrusion Detection
System Evaluations as Performed by Lincoln Laboratory. ACM
Transactions on Information and System Security, Vol. 3 No.4
Perdisci, R. 2006. Statistical Pattern Recognition Techniques for
Intrusion Detection in Computer Networks Challenges and
Solutions. Ph.D. Dissertation. University of Cagliari, Italy, and
Georgia Tech Information Security Center, College of
Computing, Georgia Institute of Technology, Atlanta, GA, USA.
Roesch, M. 1999. Snort - Lightweight Intrusion Detection for
Networks. In Proceedings of the 13th USENIX conference on
System administration (LISA '99). USENIX Association,
Berkeley, CA, USA, 229-238.
Tavallaee, M., Bagheri, E., Lu, W., Ghorbani, A. 2009. A
Detailed Analysis of the KDD CUP 99 Data Set. In proceedings
of the 2009 IEEE Symposium on Computational Intelligence in
Security and Defense Applications (CISDA 2009).
Yang, Y., Pederson, J. 1997. A Comparative Study on Feature
Selection in Text Categorization. In Proceedings of the
Fourteenth International Conference on Machine Learning, pp.
412-420.
Of all these kernels, RBF was the fastest with regards to
processing time. The slowest kernel to be processed was
the polynomial kernel which was stopped before
completion. The results of the classification analysis using
these different kernels on the Train+ and Test+ datasets
from the NSL-KDD corpus as can be seen on Table 7.
Finally, considering performance requirements, the
analysis was performed using a subset of the 19 top
features as ranked by information gain. This analysis can
be seen in the next section.
Reduced Feature Set
A test was conducted with a reduced dataset (Train+ and
Test+ datasets from the NSL-KDD corpus). Computational
speed is essential in IDS systems that run on routers and
network appliances with limited memory and processing
power. A test was conducted using a reduced feature set of
19 features. The features were selected based on the
information gain feature ranking. After conducting the
analysis, the results of the classifier were only 2% lower
than with the full set. This result is important because it
shows which features are the most important and that not
all are needed to maintain relatively good classification
accuracies.
Conclusions
The results of the analysis show that Support Vector
machines can obtain good classification results with the
newly expanded NSL-KDD IDS corpus. Additionally,
feature ranking was performed and the best features were
identified. The results show that classification with the top
half of the features obtained results which are almost as
good as when using the full set of features. After
conducting the analysis, the results of the classifier were
only 2% lower than with the full set. Future work
combining intrusion detection systems and machine
learning will include the use of sequential methods for
295


