Proceedings of the Seventh International AAAI Conference on Weblogs and Social Media
Artist Popularity: Do Web and Social Music Services Agree?
1
2
Alejandro Bellogı́n1,2 , Arjen P. de Vries1 , Jiyin He1
Centrum Wiskunde & Informatica, Science Park 123, 1098 XG Amsterdam
Universidad Autónoma de Madrid, Departamento de Ingenierı́a Informática, 28049 Madrid
{A.Bellogin, Arjen.de.Vries, J.He}@cwi.nl
social media music sites EchoNest3 , Last.fm4 , and Spotify5 ,
whereas the latter extracts click information from the Web
to derive an implicit popularity score. In this work we focus
our analysis on the similarity between the different popularity indices and the comparison of their temporal behaviour.
More specifically, our contributions are the following:
Abstract
Recommendations based on the most popular products
in a catalogue is a common technique when information
about users is scarce or absent. In this paper we explore
different ways to measure popularity in the music domain; more specifically, we define four indices based on
three social music services and on web clicks. Our study
shows, first, that for most of the indices the popularity is
a rather stable signal, since it barely changes over time;
and second, that the ranking of popular artists is heavily dependent on the actual index used to measure the
artist’s popularity.
• We obtain a dataset where information for 1,312 artists
about four popularity indices using different social media
sites has been recorded on a regular basis over a period of
2 months.
• We study the relation between these popularity indices
and their corresponding rankings. We identify that webbased popularity is more sensitive to the temporal dimension than service-dependent popularity. We have also
found that not all the popularity definitions are completely
redundant, although some similarities between the indices
do exist.
Introduction
Music popularity has been studied both from the psychology (Berns et al. 2010) and from the complex network theory (Zanin et al. 2009) points of view, among others. In
fact, due to its high marketing potential some companies
have started to analyse the presence of music artists in social media – such as ReverbNation1 and Next Big Sound2 –
to benchmark the success of each artist.
In this heterogeneous context, there could be different
definitions of what is popular in the music domain, which
could lead to inconsistencies in any application where popularity is exploited. In this paper we compare four methods to
define a music artist’s popularity using social media. To the
best of our knowledge, we are not aware of such a work in
the music domain, although similar studies have been made
in more general contexts, such as news articles (Ung 2011;
Bandari, Asur, and Huberman 2012).
Moreover, popularity rankings are useful in the Recommender Systems domain, since they provide suggestions that
tend to satisfy the majority of the people, while the cost of
producing such recommendations is generally low.
We identify two types of popularity indices: servicedependent popularity and web-based popularity. The former
refers to explicit popularity scores available in the most used
Our Analysis on Music Popularity
Data Description
We have collected several popularity indices from the following social media systems through their corresponding
APIs: EchoNest, Last.fm, and Spotify.
To obtain a set of artists relatively diverse and famous,
we consider the Last.fm’s API and collect the most popular
artists in their database, which we combine with the most
hyped (recently promoted) artists, so our data is not too biased towards already popular musicians in Last.fm. To the
best of our knowledge, the other considered social media
systems have no similar method to collect a list of artists,
which is why we have relied on Last.fm data to bootstrap
our method.
After this step, we collected 1,398 artists that went down
to 1,312 artists which were present in all three sites. Then,
we periodically (every 3 hours) request the current popularity from each artist to each social music service.
At the same time, we query Bit.ly’s API6 with the name
of each artist, to gather the number of clicks each retrieved
3
c 2013, Association for the Advancement of Artificial
Copyright Intelligence (www.aaai.org). All rights reserved.
1
http://www.reverbnation.com, accessed 11 Feb 2013
2
https://www.nextbigsound.com, accessed 11 Feb 2013
http://echonest.com
http://www.last.fm
5
http://www.spotify.com
6
http://bitly.com
4
673
alternative
blues
rock
pop Hip−Hop
punk
punk rock
hip hop
electronic
indie rock
gaga
90s
american
green day 00s
foo fighters
Rihanna
rock
rap glam
USA
Metal
Grunge
rnbindieNu
hiphop
70s
urban
reggae
classic rock Akon
britpop
alternative metal female vocalist
dance−pop
pop punk Linkin Park
singer−songwriter
the rolling stones male vocalists
System of a Down
experimental
(a) EchoNest
female vocalists UK
brit rock
Awesome
USA
alternative rock
Nu−metal
british
dance
Grunge emo
rock
pop rock
90s
pop
hardcore
alternative
indie punk
glam
green day
hard rock
britpop
Blink 182
political
sexy
punk rock
favorites
Garage Rock
Linkin Park
rapcore
Progressive rock american
english
System of a Down foo fighters
experimental new wave
Post−punk revival
(b) Last.fm
Rihanna american
swing
club
Avicii
r&b
dj
dance
barbadian
crooner
reggae
hiphop
G−funk
french
trance
50s
California
House
jazz
florida
techno
electronica
David Guetta
dubstep
dancehall
west coast
USA
electro
soul
Flo Rida
blues
frank sinatra vocal 00s
rock
swedish
Hip−Hop
deep house
party
vocal jazz
metal Lady Gaga
indie rock
rnb rap
sexy
female vocalist
alternative metal
oldies
british
metal
Queen 60s Muse
Pop−punk
electronic gaga
pop punk
Big Band
electronica
favorites
english female
glam
political
crossover
funk
skate punk
tech house
blues rock
Progressive
alternative rock
80s
easy listening
hip hop electronic
Dirty South
post−punk
Progressive indie pop singer−songwriter
post−grunge electronica
arctic monkeys
male vocalists
dance r&b soul
pop
female vocalists
hard rock
jazz vocal
rhythm and blues
Rock and Roll
heavy metal post−grunge
electropop rapcore
Lady Gaga Nu−metal black eyed peas
The Killers
legend
emo
ella fitzgerald
dancehall
link has received. A clean-up of the Bit.ly data is required
due to two major issues: (1) irrelevant documents that match
only one part of the artist’s name (e.g., ’a-ha’ or ’The xx’),
and (2) ambiguous artists for whom matched documents are
not actually related with the artist (e.g., ’Kiss’).
To handle the first situation, we require an exact match of
the complete artist’s name in the URL or in the document title. To handle the second situation, we manually assign some
terms into a whitelist (blacklist). We then restrict the set of
documents to those including (excluding) such terms. This
simple method has previously shown good performance in
terms of spam reduction (Boykin and Roychowdhury 2005),
and is satisfactory for this study. In our dataset, an example
of a whitelist term for ’Kiss’ would be rock, whereas a blacklist term for the artist ’Rush’ would be hour. We first considered automatic alternatives such as text classifiers, but the
text available for each artist is limited and they would still
require manually labelled examples. Nonetheless, we aim to
include some of these techniques in the future.
The obtained dataset with timestamped information from
the four social media systems described is available from our
website7 , along with the code and scripts used in the process.
electropop
blink−182
Table 1: Spearman’s ρ and Kendall’s τ correlation coefficients between the service-dependent popularity indices.
NuTheMetal
Killers
1.00
California
1.00
0.47
user base has a strong bias to Europe and the US, which
may actually represent a wider diversity than Last.fm.
We may conclude from the results in the table that each
index is actually capturing different nuances of an artist’s
popularity, since no index is perfectly correlated with any
other. In fact, this effect is more clear when we compare the
most frequently used tags for the top artists according to the
ranking of each popularity index.
Figure 1 shows a tag cloud for each service-dependent
popularity taking the Last.fm’s tags from the top 20 artists
according to each index. We observe that, like with the correlation values, Last.fm and EchoNest clouds are similar but
not identical, whereas Spotify is the most disparate among
the three social media sites discussed so far.
soad
popS
Muse
popL
00s
1.00
popE
1.00
0.72
0.56
heavy metal crossover
diva
1.00
0.66
τ
popE
popL
popS
pop rock
popS
sexy
popL
Progressive rock
popE
1.00
0.88
0.75
UK
ρ
popE
popL
popS
female
gangsta
legend
barbados
lounge
Snoop Dogg
male vocalists
female vocalists
(c) Spotify
Figure 1: Tag clouds for the top-20 most popular artists of
each media. Word size is proportional to the tag frequency.
Web-Based Popularity Index
An alternative way of measuring popularity of artists is to
look at the Web at some specific moment in time and observe which artists are currently being talked about and referring to. With this goal in mind, we use Bit.ly media site
as a surrogate of the Web use, and use the clicks received by
each document related with an artist to define a popularity
index based on Bit.ly data (popB ).
We specifically look into the temporal dynamics of this
web-based popularity, and compare it against that of servicedependent popularity indices. That is, we analyse whether
popularity changes across the temporal dimension and if any
difference between web-based and service-dependent popularity indices exist at this level.
For this analysis, we show in Figure 2 the time series
of the four popularity indices described previously for two
artists during a period of 3 weeks. We have to note that both
Last.fm and Bit.ly popularity indices have been aggregated
after applying a (natural) logarithm function to the playcounts and clicks, respectively.
A first thing we notice in Figure 2 is that the web-based
popularity index presents large deviations with peaks at specific events related with each artist. For instance, Lupe Fiasco had to be removed from the stage on January 20 during
his performance in celebration of Obama’s reelection, which
received a lot of attention until January 28. Interestingly, we
also notice a steep increase in popL (Last.fm scrobblings figure) when this index is updated (January 30), more prominent than the increment in The Black Keys’s figure, whose
web-based popularity was much lower at that moment.
On the other hand, the service-dependent popularity indices do not change as frequently as web-based. This is a
problem for the service-dependent popularity indices, since
the update times of such indices could be different for each
artist; more specifically, these updates are usually not done
Service-Dependent Popularity Indices
Depending on the social media system, we may define different notions of popularity, or in other terms, a servicedependent popularity index. For Last.fm, we match the number of playcounts (or scrobblings) of each artist to their popularity (popL ); whereas for Spotify (popS ) and EchoNest
(popE ) we use explicit popularity scores provided by them8 .
We analyse the similarity among the service-dependent
popularity indices by computing correlation scores. As we
validate later on, the temporal dimension has almost no effect on these indices, thus they can be ignored safely for the
present analysis. Table 1 shows Spearman’s and Kendall’s
correlation coefficients for the service-dependent popularity
indices using the full set of 1,312 artists, allowing us to compare how related these indices are; the closer such value is
to 1.0 for two popularity indices, the stronger the relation
between them.
We observe that Spotify’s popularity is the most divergent index in terms of correlation. We believe this could be
caused by at least the following two reasons: first, the catalogue of Spotify is limited due to the contracts with several
companies, and thus, its users cannot listen to some artists
(such as The Beatles), and, second, the demography of its
http://www.cwi.nl/∼media/papers/ICWSM13
Specifically, for EchoNest we consider the familiarity property
equivalent to popularity, stated as their numerical estimation of how
familiar an artist currently is to the world; the situation for Spotify
is not so clear, although it is likely that an artist’s popularity score
depends on how many people listen to their songs.
7
8
674
●●
●
●
●●
●●
●
●
●●●
●
●
●
●●
●●
●
●
●●
●
●●●
●
●
●
●●●
●●●
●●●
●●
●
●●●●●
●●
●
Bit.ly
Bit.ly
80
70
60
50
40
30
20
●
●
●
●
●●
●
●
Jan 21
Jan 28
Feb 04
Feb 11
Feb 18
Feb 25
Mar 04
Mar 11
Mar 18
Last.fm
Last.fm
17.295
17.290
17.285
Jan 28
●
●
●●
●●
●●●
●●
●
●●
●
●
●●
●
●●
●
Jan 28
●
●
●
●●
Feb 04
●
●
●
●
●●
●
Feb 11
Feb 18
Feb 25
●
●●
●
●●
●
●●●
●
●
●
Mar 04
●●●
Mar 11
●●●●
●
Mar 18
18.16
18.15
18.14
18.13
18.12
Feb 04 Feb 11 Feb 18 Feb 25 Mar 04 Mar 11 Mar 18
Jan 21
Jan 28
Feb 04 Feb 11 Feb 18 Feb 25 Mar 04 Mar 11 Mar 18
Jan 21
Jan 28
Feb 04 Feb 11 Feb 18 Feb 25 Mar 04 Mar 11 Mar 18
1.0
0.9
0.8
0.7
EchoNest
Spotify
Popularity
1.0
Popularity
●●
●
●
Jan 21
17.300
Jan 21
60
50
40
30
20
10
0
0.9
0.8
0.7
EchoNest
Spotify
0.6
0.6
Jan 21
Jan 28
Feb 04 Feb 11 Feb 18 Feb 25 Mar 04 Mar 11 Mar 18
(a) Lupe Fiasco
(b) The Black Keys
Figure 2: Temporal dynamics of the web-based and service-dependent popularity indices analysed.
1.0
at real time, and not even in a daily basis, which does not
allow a granularity as fine as we would desire.
We also observe in the figure that Last.fm has larger
changes in its popularity index, since it is measuring the raw
number of playcounts; whereas the other popularity indices
(EchoNest and Spotify) have less variation. More specifically, EchoNest seems pretty stable, however we have to
note that there are tiny changes (i.e., in the fifth decimal
number) on the returned value; similarly, no large leaps are
obtained in each update of the Spotify’s index, which is updated every 5 days on average.
Therefore, we conclude that temporal dynamics are stronger in the web-based popularity and could be used to monitor the presence of an artist in the Web. Nonetheless, some
correspondence has been found between such index and the
Last.fm’s popularity index, although finer measurements of
this value would certainly be more useful. In the future we
aim to validate this by predicting artist popularity based on
clicks, as it was done with search logs in (Goel et al. 2010).
●
0.8
●
0.6
●
●
0.4
●
●
0.0
0.2
●
●
●
● ●
20
200
400
600
800
J(EchoNest, Bit.ly)
J(Last.fm, Bit.ly)
J(Last.fm, EchoNest)
J(Spotify, Bit.ly)
J(Spotify, EchoNest)
J(Spotify, Last.fm)
1000
1200
Figure 3: Jaccard similarity index when different cutoffs for
the length of the top artist lists are considered.
Bit.ly
One Direction
Kelly Clarkson
Anne Hathaway
Taylor Swift
Justin Bieber
EchoNest
Coldplay
Rihanna
Radiohead
RHCP
Eminem
Last.fm
The Beatles
Radiohead
Coldplay
Muse
RHCP
Spotify
Johnny Cash
Frank Sinatra
Elvis Presley
Kanye West
Snoop Dogg
Table 2: Top most popular 5 artists for each popularity index
(RHCP stands for Red Hot Chili Peppers).
Comparison of Popularity Indices Based on
Artist Rankings
Table 2 shows an example of these rankings when the top
5 most popular artists are considered throughout the timespan of our dataset. Again, web-based popularity presents
a list of artists very different in comparison with that of the
service-dependent popular rankings. Among these, Spotify’s
ranking has almost no intersection with the rest, confirming
the behaviour shown in Figure 3.
We now analyse the stability of the different popularity
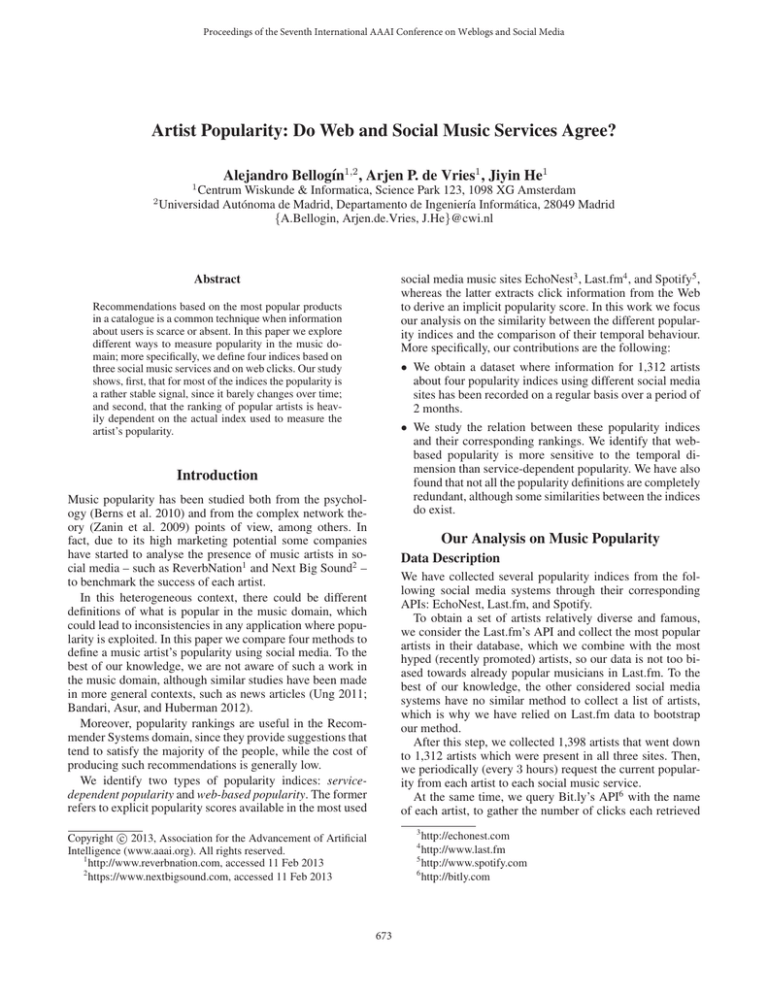
indices described in the paper. Figure 4 shows the average
difference in ranking
position, that is, for each index p, we
compute 1/|A| a∈A rankt (a, p) − rankt−1 (a, p), where A
is the set of all artists. This value summarises the behaviour
of the artist-level time series for each popularity index p.
Thus, we observe from the figure that the ranking obtained from the web-based popularity is more sensitive to
fluctuations of people’s interests than the other popularity indices, reproducing the observed changes almost at real time.
Figure 4 also shows that service-dependent popularity remains quite stable through time, as we already observed in
the previous section with Figure 2. A plausible reason for
Popularity indices are used typically in real applications to
generate artist rankings according to their popularity, thus,
we now analyse the similarity and temporal dynamics of
the web-based and service-dependent popularity indices in
terms of the rankings generated by such indices.
Figure 3 shows how the similarity changes when an increasing number of artists is considered from each index.
Metrics such as correlation coefficients would not be applicable now, since the intersection could be, eventually, empty.
Instead, we use Jaccard coefficient as the similarity metric,
which is computed as the size of the intersection divided by
the size of the union of two sets; in our context, each set corresponds to the artists at top-N of two popularity rankings.
Consistent with the correlations and tag clouds presented
before, Last.fm and EchoNest are the two indices sharing a
larger number of artists for any cutoff value. Web-based popularity (Bit.ly) provides a more diversified ranking in comparison with the service-dependent popularity, since the corresponding Jaccard similarities are the lowest.
675
30
●
●
●
●
0
10
●
●
●
●● ●
●
●
●
●
●
● ●
●●
●
●
●
● ● ●
●
●
●
●
●
−20
●
●
●
● ●
●
●
●
●●
●
●●
● ●● ● ●●
Feb 11
Feb 21
●
Mar 03
Open questions
Once we have analysed different sources of popularity, two
important questions remain open. Are users more interested
in the artists that are popular now or do they prefer those that
are always popular? Furthermore, should all the reasons why
an artist could be popular considered equally? Perhaps users
are more likely to listen to an artist when they release a new
album than when they are getting married or having a baby,
even though the fact of appearing in the news may increase
an artist’s success in general (see Lupe Fiasco’s case).
●
Mar 13
●
−0.5
●
Jan 22
Bit.ly
Feb 01
●
●
●
●
●
●
●
●●
●
●
● ●
●
●
●
●
0.5
Feb 01
●
●
●
Jan 22
document really deals about an artist; for this, entity disambiguation techniques would be very helpful.
●
●
●
Feb
11
Feb 21
EchoNest
Mar 03
Last.fm
Mar 13
●
Spotify
Figure 4: Average difference in the ranking position. Lower
image shows a zoom of the same image to better appreciate
the changes in the service-dependent indices.
Conclusions
In this paper we analysed three different social music services to measure popularity in the music domain. We have
found that the service-dependent popularity indices show almost no temporal patterns, probably because they are not
updated in a daily basis; besides, these indices are similar
but not equivalent, neither in terms of ranking nor in the
genres or tags associated with their most popular artists. We
also proposed a novel method to capture popularity directly
from the Web, this index shows more temporal changes
than the service-dependent counterparts in terms of ranking,
and it arises as an alternative more biased towards the near
rather than the distant past, in contrast to the more traditional
service-dependent popularity indices. In the future, we aim
to analyse these indices with larger amounts of data and using more sophisticated techniques, both for the process of
the time series and the document filtering step required by
the web-based approach.
this effect may be due to the fact that EchoNest and Spotify
indices come from a ranking normalisation step. As we can
observe from Last.fm data, raw popularity rankings are also
pretty stable throughout time, although slight changes may
arise (see the lower part of the image).
Discussion
Practical Implications
We have found that the web-based popularity index is different from the service-dependent popularity indices, and in
general, no two indices are completely redundant or equivalent. This could be exploited in a recommendation environment to provide diversity into non-personalised recommendations, by combining the suggestions coming from different popularity approaches.
Regarding the stability of the service-dependent popularity, a plausible reason for this effect may come from the long
tail preferences of the consumers of these services, which
helps to stabilise the time series of ranking popularity for
such indices. This is a key difference between the web-based
and service-dependent popularity indices: whereas the latter
is static and shows smaller variations, the former is dynamic,
reacts to the change of mind and interests of the user in the
short term, and seems to be unaffected by the preferential
attachment of preferences (Zanin et al. 2009).
Acknowledgements
This work was carried out during the tenure of an ERCIM
”Alain Bensoussan” Fellowship Programme, funded by European Comission FP7 grant agreement no.246016.
References
Bandari, R.; Asur, S.; and Huberman, B. A. 2012. The pulse
of news in social media: Forecasting popularity. In ICWSM.
The AAAI Press.
Berns, G. S.; Capra, C. M.; Moore, S.; and Noussair, C.
2010. Neural mechanisms of the influence of popularity on
adolescent ratings of music. NeuroImage 49(3):2687–2696.
Boykin, P. O., and Roychowdhury, V. P. 2005. Leveraging
social networks to fight spam. IEEE Computer 38(4):61–68.
Goel, S.; Hofman, J. M.; Lahaie, S.; Pennock, D. M.; and
Watts, D. J. 2010. Predicting consumer behavior with web
search. PNAS 107(41):17486–17490.
Ung, H. M. 2011. Social influence, popularity and interestingness of online contents. In ICWSM. The AAAI Press.
Limitations
Our analysis has some limitations that call for further investigation in the future. First, this study is fairly generic,
with no constraint on region or country; however, even in
our globalised culture, each country has its own set of circumstances that may restrict the relevance of a news item related with a particular artist. For instance, concerts are local
events, important to a specific community. Thus, we should
conduct a similar analysis but focused on a local area.
Second, regarding the web-based popularity index, we
should take into account the sentiment of the context when
an artist has been mentioned. This way, it would be possible to define a positive and negative popularity, which would
provide, in turn, much richer information about how an artist
is perceived throughout time. Also, it is important to develop
accurate disambiguation techniques to discriminate when a
Zanin, M.; Cano, P.; Celma, Ò.; and Buldú, J. M. 2009.
Preferential attachment, aging and weights in recommendation systems. I. J. Bifurcation and Chaos 19(2):755–763.
676


