Proceedings of the Sixth International AAAI Conference on Weblogs and Social Media
Cross-Community Influence in Discussion Fora
Václav Belák and Samantha Lam and Conor Hayes
vaclav.belak@deri.org, samantha.lam@deri.org, conor.hayes@deri.org
Digital Enterprise Research Institute, NUI Galway
IDA Business Park, Lower Dangan
Galway, Ireland
Abstract
forum A
Online discussion fora have become an important cultural and business asset in the context of many services
provided by both non-profit organizations and enterprises. In order to keep and eventually increase the value
these systems deliver to their users, it is often necessary
to moderate or even manage their dynamics. One way to
do this efficiently is to focus primarily on the most influential actors in the system. However, identifying such
users becomes increasingly hard with systems where
there is a continuously growing large user base. We
show that analysis and explanation of influence on the
cross-community level is a promising way to provide a
coarse-grained picture of a potentially very large system
and that it may enable its stakeholders to find groups
through which the system can be efficiently influenced,
or it can help them to identify and avoid activity considered as malicious. In order to achieve that, we present
a novel framework for cross-community influence analysis, which is evaluated on 10 years of data from the
largest Irish online discussion system Boards.ie.
5
forum B
2
1
6
4
3
7
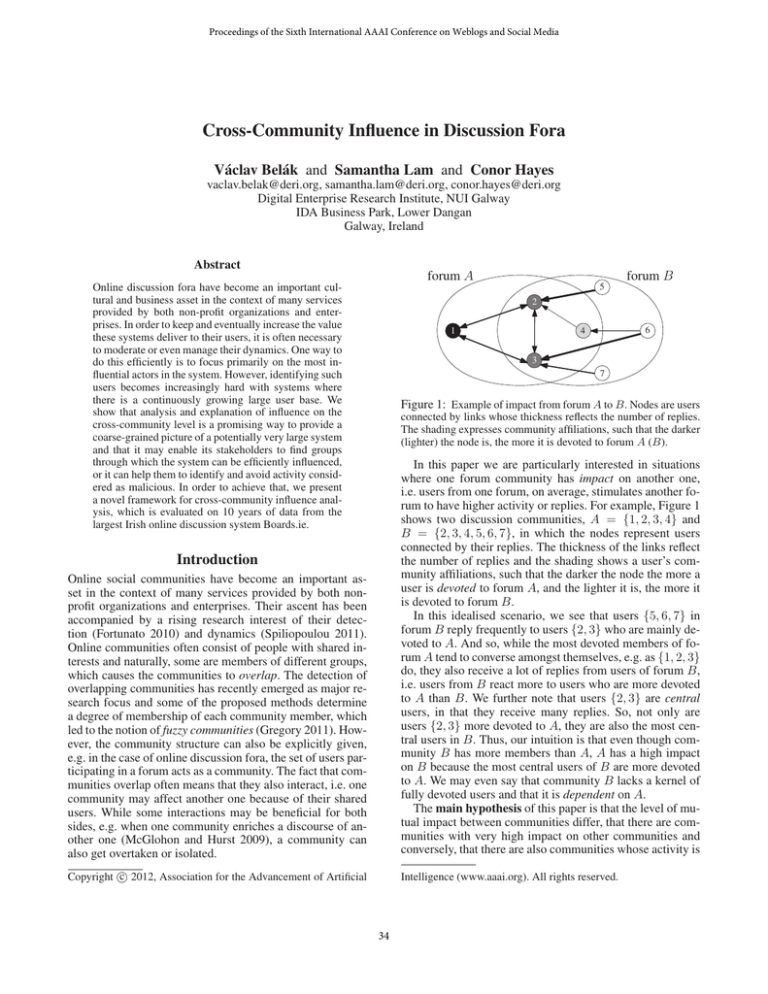
Figure 1: Example of impact from forum A to B. Nodes are users
connected by links whose thickness reflects the number of replies.
The shading expresses community affiliations, such that the darker
(lighter) the node is, the more it is devoted to forum A (B).
Online social communities have become an important asset in the context of many services provided by both nonprofit organizations and enterprises. Their ascent has been
accompanied by a rising research interest of their detection (Fortunato 2010) and dynamics (Spiliopoulou 2011).
Online communities often consist of people with shared interests and naturally, some are members of different groups,
which causes the communities to overlap. The detection of
overlapping communities has recently emerged as major research focus and some of the proposed methods determine
a degree of membership of each community member, which
led to the notion of fuzzy communities (Gregory 2011). However, the community structure can also be explicitly given,
e.g. in the case of online discussion fora, the set of users participating in a forum acts as a community. The fact that communities overlap often means that they also interact, i.e. one
community may affect another one because of their shared
users. While some interactions may be beneficial for both
sides, e.g. when one community enriches a discourse of another one (McGlohon and Hurst 2009), a community can
also get overtaken or isolated.
In this paper we are particularly interested in situations
where one forum community has impact on another one,
i.e. users from one forum, on average, stimulates another forum to have higher activity or replies. For example, Figure 1
shows two discussion communities, A = {1, 2, 3, 4} and
B = {2, 3, 4, 5, 6, 7}, in which the nodes represent users
connected by their replies. The thickness of the links reflect
the number of replies and the shading shows a user’s community affiliations, such that the darker the node the more a
user is devoted to forum A, and the lighter it is, the more it
is devoted to forum B.
In this idealised scenario, we see that users {5, 6, 7} in
forum B reply frequently to users {2, 3} who are mainly devoted to A. And so, while the most devoted members of forum A tend to converse amongst themselves, e.g. as {1, 2, 3}
do, they also receive a lot of replies from users of forum B,
i.e. users from B react more to users who are more devoted
to A than B. We further note that users {2, 3} are central
users, in that they receive many replies. So, not only are
users {2, 3} more devoted to A, they are also the most central users in B. Thus, our intuition is that even though community B has more members than A, A has a high impact
on B because the most central users of B are more devoted
to A. We may even say that community B lacks a kernel of
fully devoted users and that it is dependent on A.
The main hypothesis of this paper is that the level of mutual impact between communities differ, that there are communities with very high impact on other communities and
conversely, that there are also communities whose activity is
c 2012, Association for the Advancement of Artificial
Copyright Intelligence (www.aaai.org). All rights reserved.
Introduction
34
significantly influenced by others. Analysis and explanation
of the cross-community impact is a promising way to provide a coarse-grained picture of a reasonably large system.
It can enable its stakeholders to find groups through which
the system can be efficiently influenced (e.g. for assigning
local authorities), or it can help them to find and avoid activity considered as malicious (e.g. “flame wars” between rival
groups). In particular, we are concerned with the following
questions:
context of social media analytics refer to the ability of an
actor to change behaviour of its neighbours (Sun and Tang
2011), our definition of community influence is specifically
tied to the conversational activity.
The remainder of the paper is organised as follows. In
the next section we refer to the related work. The framework itself together with the data-set and its preparation is
discussed in Preliminaries. Its evaluation is then presented
in Results in which we analyse Boards.ie on different levels, from the level of global patterns of cross-community influence, to the level of individual time-series of impact between pairs of communities. The last section concludes the
paper and outlines potential applications and extensions of
the framework. Finally, all the data and scripts, along with
our previous experiments, are publicly available in the online supplementary material.3
• How can we identify communities persistently affecting
other communities?
• Given a specific community, which communities are its
key influencers? Which communities are dependent on
the activity of others?
• Over time, how can we identify that a community is being increasingly influenced or even overtaken by another
community?
Related Work
Online discussions have been extensively researched with
respect to the user conversational, grouping, and crossposting behaviour. In one of the earliest studies, Whittaker
et al. (1998) researched three classes of factors influencing
conversational dynamics in USENET: conversational strategy, demographic factors, and interactivity represented by
reply-to behaviour. A specific feature of USENET is that it
is possible to send or forward a message to multiple fora —
to cross-post it. The authors found that cross-posting leads
to higher interactivity and hypothesised that it brings more
diversity into the conversation and thus spawns new activity. McGlohon and Hurst (2009) draw on their results
and looked closer at the flow of information represented by
cross-posting. As a cross-posted message belongs to multiple groups, they developed a thread-ownership model based
on the notion of author-group devotedness of the users measured by the distribution of their activity. In our analysis we
draw on their approach and measure the devotedness in a
similar manner. However, although there is no explicit crossposting in Boards.ie, its users can and do post in multiple
fora which are replied to by members of other fora.
The reply-to activity as an atomic element of online interactions has been a subject of multiple studies. For example,
Arguello et al. (2006) shed some light onto what influences
the likelihood that a user receives a reply from a USENET
group. Kumar, Mahdian, and McGlohon (2010) developed
several generative models of conversational (thread-like)
structures and used these models to e.g. cluster online discussions based on their prevailing characteristics — for example discussions with more “skinny” or “bushy” threads.
Sun et al. (2011) evaluate a sidebar mechanism which recommends threads to users based on social influence with the
aim of maximising user participation in threads.
In addition, the problem of finding influential actors
within a social network has been intensively studied in social
network analysis (Wasserman and Faust 2009). For the individual actors a classic approach is to use heuristics like actors’ degree or PageRank. Everett and Borgatti (1999) generalised several centrality measures to groups of actors. For in-
One conceivable way of tackling these questions is to investigate fora with the highest activity and size, or to first
create a community graph (Pollner, Palla, and Vicsek 2006)
and use centrality measures like PageRank or betweenness
to identify the key fora. We have conducted these experiments and refer on them in the online supplementary material.1 In short, we found that such centrality measures correlated strongly with the activity of fora and that fora selected
on the basis of activity lacked a kernel of strongly devoted
users, which in turn misses fora which arguably are the true
authorities (such as moderating fora).
These findings led us to the development of a novel framework for cross-community impact analysis, which is based
on purely structural features, derived from a dynamic replyto graph. Although this framework is flexible and can be
extended to exploit other features e.g. content-based ones,
this is not necessary, and we find that we can obtain a rich
cross-community analysis without it. This is useful for when
the data available has little external information, perhaps due
to legal reasons or other. Moreover, it is based on a widely
known notion of actor centrality which makes its interpretation somewhat easier. We evaluate our framework on 10
years of data from the largest Irish online discussion system Boards.ie2 , and we show that in contrast with activitybased measures, our method can clearly identify communities which are arguably more influential. The main contributions of this paper are as follows:
1. We provide a flexible and extensible framework for
structural-based analysis of cross-community impact.
2. We extend a notion of centrality of individual actors in a
social network to the level of communities.
3. A cross-community analysis of 10 years of Boards.ie was
carried out and the key fora were identified, as well as
their relations over time.
We note that in this paper we use “influence” and “impact” interchangeably. While the notion of influence in the
1
2
See http://belak.net/doc/2012/icwsm.html.
See http://www.boards.ie.
3
35
See http://belak.net/doc/2012/icwsm.html.
stance, they defined group degree centrality “as the number
of non-group nodes that are connected to group members”.
Hence the group degree captures relation between a group
of actors and the rest of the network but not between two
or more groups. The generalisation to the inter-community
level is thus lacking.
In summation, none of the previous work has discussed
the mutual impact between discussion communities and the
aim of this paper is to fill this gap.
contribute a message in another fora, i.e. a cross-fora posting waiting time. If the author has not posted to any other
fora, then τ (p) = ∞. In order to find out a suitable timewindow size, we sampled 10,000 posts and investigated the
distribution of τ (·). Table 2 lists values of the empirical distribution function of τ (·) for some selected times. It turned
out that in approximately 84% of the cases a user has posted
into another fora within 7 days, while 14 days period covers 88%. This means that doubling the window size would
lead to an increase of only 4% in the coverage of cross-fora
posting activity, and thus we decided to use a one-week window for our analysis. In total the data was segmented into
521 weekly snapshots. However, as some of the early snapshots were empty, we created a cut-off point from the first
73 weeks and used the next 448 snapshots between Monday
12.7.1999 and Sunday 10.2.2008 for our analysis.
Preliminaries
This section presents the framework we have developed for
the measurement and exploration of mutual impact of communities and the data we used to evaluated it. First we describe the analysed system and data-set. Then we formally
define the notion of cross-community impact and other related measures, which were motivated in particular by two
related questions: first, are there communities with impact
on other communities? and secondly, how does the impact
evolve over time?
t (days)
ecdfτ (t)
1
0.6806
2
0.7373
5
0.8152
14
0.8817
Table 2: Values of the empirical cumulative distribution function
ecdfτ (t) for selected waiting times.
Boards.ie
Mutual Impact of Fuzzy Communities
Boards.ie is structured according to themes into fora, optionally further into their subfora, and finally into threads of
posts centred around a particular conversation topic. Each
post has its author, who can be either a registered user or a
guest. Since all the guests’ posts are stored with the same
user identifier, we omitted them from the analysis. A set of
users who have posted at least once to a given forum within
a certain time-period form a community of that forum in
the period. Threads have a tree-like structure as one post
can be in reply to another one. The set of users linked by
the who-replies-to-whom relation thus form a directed dynamic graph weighted by the number of replies each user has
replied to another user within a given time period. We particularly looked for communities of users persistently triggering high volume of activity in other communities and we
took reply-to behaviour as a measure of such activity. Since
the mutual dynamics of communities can be highly volatile
in time, we segment the data using a sliding time-window
and analyse the changes between the subsequent snapshots
of the resulting sequence s1 , . . . , sT . Table 1 presents some
basic statistics of the analysed data.
We want to characterise to what extent one community
is influencing another one as depicted in the ideal case
in Figure 1. In that scenario, users mostly devoted to B,
{4, 5, 6, 7}, reply mainly to its central users {2, 3} who are
mostly devoted to A, and therefore A has an impact on B.
Thus, any measure of impact between communities should
take into account two factors: the degree of membership of
each user and its centrality within each community. In this
section we show how to express and combine these factors
and how to derive additional measures which are helpful in
the interpretation of the cross-community impact. We consider a general case of k communities and n users.
In order to represent which communities and to what extent an actor belongs to, let us define an n × k membership
k
matrix M : mij ∈ [0, 1], ∀ i : j=1 mij = 1 representing
users’ affiliations. Columns of M are fuzzy sets representing the individual communities. M can be known a priori
e.g. from an in-field survey, determined by a community detection algorithm (Fortunato 2010), or from activity traces
p
of users. In our analysis mij = k ij p , where pij is the
j=1
number of snapshots (T )
number of communities
mean number of communities per snapshot
mean community size (# users) per snapshot
post count
reply count
7
0.8416
ij
number of posts an i-th user posted to j-th forum. Hence we
measure the level of devotedness of a user by its activity in a
similar manner to the work of McGlohon and Hurst (2009).
An impact of any given user within its communities can
be formalised as an n×k centrality matrix C with elements
cij representing an impact of i-th user to the other users of
j-th community. It can be obtained by some centrality measure of a user, e.g. PageRank, in-degree, closeness, etc. We
set cij as the number of replies a user received in a community, which is an in-degree of i-th user in a reply-to graph
of j-th community. We chose in-degree for our experiments
because the reply behaviour is the cornerstone of the conversational dynamics; it is a well-established heuristic for influence maximisation (Kempe, Kleinberg, and Tardos 2003)
and it has a clear interpretation.
448
636
159
27.52
8,189,148
7,524,427
Table 1: Elementary statistics about the analysed data-set.
Time-Window Selection In order to segment the data, it is
necessary to find a suitable size for the time-window. As our
methods are based on cross-fora posting activity, the window
length should capture as much of that activity as possible,
yet still fine enough to uncover changes in users’ behaviour.
Let τ (p) be a minimum time it took an author of post p to
36
The k × k cross-community impact matrix J can then be
obtained as a product of the two matrices: J = MT C. The
elements Jij represent weighted sums of centralities of the
users of i-th community in j-th community. However, social
communities usually have different sizes (Palla et al. 2005),
which can bias the impact matrix. A very big community
can, from its raw size, accumulate high values in J despite
the fact that its members are not very devoted to it. Therefore
we further divide the rows of the impact matrix by the cardinalities (Zadeh 1983) of the sets representing the communities — sums of the columns of the membership matrix — in
order to obtain a normalised impact matrix:
Jij
l=1 Ml,i
Ĵij = n
of Ĵ. Because some elements of Ĵ may be 0, let us define the
convention log2 (0) = 0. Further it is necessary to normalise
the rows of the matrix in order to obtain probability distribuk
tions of impact, i.e. ĴN
i,j = Ĵi,j /
l=1 Ĵi,l . The normalised
importance entropy of i-th community is then defined as
k
ĴN log2 ĴN
im
(5)
HI (i, Ĵ) = − m=1 im
log2 k
The dependence entropy HD (i, Ĵ) is defined similarly but
on the transpose ĴT . Both measures have range within [0, 1].
The more the importance (dependence) of i-th community is
equally distributed, the more the entropy value is close to 1.
We note that in the case of entropy we include the diagonal
elements (independences), because in such case it differentiates whether the most of the community’s total impact is
concentrated within that community or not.
For each time-snapshot we computed an importance matrix leading to a sequence ĴS = (Ĵ1 , Ĵ2 , . . . , Ĵ448 ). It is
also possible to aggregate this sequence e.g. by computing
its mean ĴS . All the previously defined functions like importance I(·) or dependence D(·) can then be defined on the
aggregate straightforwardly.
(1)
The normalised impact Ĵij then represents a weighted mean
of centralities of members of i-th community in j-th community. The diagonal of Ĵ contains independence values
(self-impact), i.e. it measures to what extent the highly devoted members of each community are also central in it. If
we subtract the diagonal from Ĵ, we can obtain a vector of
total impact as row sums:
I(Ĵ) = Ĵ1 − diag(Ĵ)
(2)
Results
where 1 is a column vector of ones of length k. We call the
total impact computed by I(·) a community’s importance,
which measure how much impact a community has in total.
Similarly, a vector of the column sums contains, at the i-th
position, the total impact other communities have on the i-th
community — a community’s dependence:
D(Ĵ) = ĴT 1 − diag(Ĵ)
We used the framework to analyse fora in Boards.ie in order to evaluate its suitability to reveal and explain crosscommunity influence on three different levels. First, we
grouped together similar communities according to their impact and dependency relations with other fora in order to get
a global overview of what classes of communities emerge,
i.e. to show a high-level cross-community impact interaction in the system. Based on that, we further investigated
communities identified as highly influential or dependent in
time, and finally, we looked even closer to the level of pairs
of communities and analysed how one community affected
the other over time.
(3)
Please note that by definition it is possible that Ĵij > 0
and Ĵji > 0, i.e. i-th community has an impact on j-th and
j-th has some impact on i-th community as well. However,
the values may differ and it is exactly these differences in
mutual impact we are interested in because we specifically
look for pairs of communities that are in some sort of imbalanced relationship. For instance, if community A has high
impact on community B, as idealised in Figure 1, then we
find that the most central users of B are mostly devoted to A,
rather than B. Using the introduced concepts we formalise
this intuition by saying that an impact of i to j is significant
if it is at least as high as the independence of j, which is
expressed by the following function:
Ĵij
≥1
1
diag(Ĵ)j
ψ(i, j, Ĵ) =
(4)
0
otherwise
Different Groups of Important/Dependent Fora
In order to gain some first insights into the cross-community
impact behaviour in Boards.ie we wanted to see if we
could group similar fora together according to their impact/dependent behaviour. To do this we found groups
formed by clustering the communities embedded in the row
and column spaces of the impact matrix. Recall that rows
represent the impact a community has on other communities,
whereas columns express impact other communities have on
the given community, dependence. To do this we first took
the mean ĴS of the whole sequence of snapshots ĴS and
set the diagonal of the aggregate matrix to 0 so as to focus only on cross-community relations. Next we embedded
the communities into row and column spaces of the resulting matrix and obtained importance- and dependence-based
clusters using the k-means algorithm.4 It can be seen in Figure 2 that there are clear clusters in both spaces. The number
While some communities may have impact to a relatively
small circle of other communities, others may be broadly
influential. For instance, a community of system administrators may have an impact to the whole system. Analogously,
a community may be influenced by many other communities or it may be strongly influenced just by few fora. Such
feature of a community’s importance or dependence can be
characterised as an entropy of the respective row or column
4
We ran k-means with 100 random seeds each with 100 iterations.
37
●
2.5
●
133
82 ●
●
●
●
4
6
8
●
●
●
●
●
●
3
●
10
●
1.5
2
●
●
5
7
●
●
9
0
0.0
0.5
1
1.0
●
3
●
2
2.0
●
log(dependence)
●
log(importance)
7
●
4
●
0.3
0.4
0.5
0.6
0.7
0.4
0.5
row entropy
0.6
0.7
0.8
column entropy
(a) overall importance and its entropy
(b) overall dependence and its entropy
Figure 2: Overall logarithmically scaled importance and dependence, and their entropies. The shapes and colours denote clusters of communities embedded in the row (importance), resp. column (dependence) spaces. Circles, squares, diamonds, and triangles represent cluster 1 (I),
2 (II), 3 (III), and 4 respectively. As insets are plotted within cluster sums of squares (y axis) for different number of clusters (x axis) — note
the characteristic “elbow” for four (a) and three (b) clusters. Fora F EEDBACK, M ODERATORS, and A FTER H OURS are marked with their IDs
82, 133, and 7, respectively. For the sake of clarity only communities with importance (dependence) of at least 1 are plotted and thus large
parts of clusters 2 and III are not displayed.
cluster
1
2
3
4
of clusters was determined by investigating the distribution
of within cluster sums of squares, which has a characteristic
“elbow” in both cases around 4 and 3 for importance- and
dependence-based clusters respectively — see the insets of
Figures 2a and 2b. The points are individual communities
and their shapes and colours denote their clusters. For the
sake of clarity only communities with importance (dependence) at least 1 are plotted.5
size
5
461
137
33
in-degree
68.7
15.6
29.46
55.99
# user
61.21
14.73
38.9
58.2
# post
285.14
42.79
114.48
167.6
import.
6.24
0.3
1.39
2.85
Table 3: Number (size) of the importance-based clusters and the
average group in-degree, number of active users, number of posts,
and importance for each cluster. The maximal values are in bold.
Row-based clustering: Impact The communities in Figure 2a are plotted against their logarithmically scaled importances (see Eq. 2) and the corresponding entropies (Eq. 5) in
order to characterise how much was each forum important
and whether its influence was distributed equally or not. We
found it surprising that although the clusters were obtained
by clustering rows of impact matrix only, they clearly follow the importances of the communities and their entropies,
which was not used for the clustering whatsoever. It suggests that using only the importance and entropy alone may
be enough to discriminate different classes of communities
with respect to their impact to other communities.
Table 3 lists some statistics for the clusters, which clearly
follow the level of the overall importance. The group indegree is the number of replies received by members of
a community from the non-members, and its average was
computed from the group in-degrees obtained for each
snapshot of the reply-to network. The smallest cluster, 1,
consists of five communities M ODERATORS, F EEDBACK,
T HE T HUNDERDOME, H UMANITIES, and T HE C UCKOO ’ S
N EST, all with very high average metrics as seen in Table 3.
In particular, the first two are highly important to a lot of
communities which follows from their outstanding position
in the top-right corner in Figure 2a. As their titles suggest
M ODERATORS is a private community comprising of users
moderating and facilitating discussion in other fora, while
F EEDBACK is a public forum for users to provide feedback
to the system maintainers. Therefore, members of both fora
should naturally have high authority and impact in other
communities. Conversations in T HE T HUNDERDOME have
one main purpose: to provoke and insult other participants
under the agreed rules.6 Since the impact measures the ability of one community to stimulate another one, it is no surprise that a community specifically focusing on provocation
was recognised as influential.
Clusters 3 and 4 are less-clearly separated and they consist of many general, mid-level fora like P ERSONAL I S SUES, F ILMS, H UMOUR , A FTER H OURS , etc. which have
a relatively high average number of posts suggesting that
these clusters represent fora where every-day conversation
5
Again, the full listings of the clusters are provided only in the
supplementary material.
6
38
http://www.boards.ie/vbulletin/forumdisplay.php?f=484
community
A FTER H OURS
T HE C UCKOO ’ S N EST
P OKER
B EER G UTS & R ECEDING H.
S OCCER
within Boards.ie happens. For instance, the most popular
and biggest forum A FTER H OURS is a general-topic common meeting place for chat (see Table 5 for the list of the
most active communities). The impact measure therefore
clearly captures a different quality not expressed by a simple
post or member counts. The remaining cluster, 2, contains
the majority of all the communities and have low values on
all given metrics. This cluster contains many fora of very
specific topics like B UDDHISM, S OCIAL M EDIA, or C HESS.
cluster
I
II
III
size
1
13
622
in-degree
67.76
64.03
24.23
# user
317.02
110.19
23.79
# post
1375
395.18
64.14
in-deg.
71.97
73.79
38.86
85.71
67.96
# user
338.9
89.86
135
98.88
144.5
# post
1472
930.1
903.2
860.4
859.3
Table 5: The average group in-degree, number of active users, and
number of posts for the 5 communities with the highest average
post counts.
depend.
55.02
10.05
0.43
dence) value at each time slot. We expected to uncover emergence of persistently influential communities, or transitions
of a community from e.g. being important to become dependent. At each snapshot, we took the forum with the highest
importance (dependence) value and then normalised it by
dividing by the total importance/dependence value for that
given time. This ensures that the value is comparable over
the whole time period and Figure 3 shows the distribution
of the fora which have the highest respective values at least
three times over the 448 weeks.7 The ordering is such that
the forum whose value was the highest at the earliest available time slot is displayed from top to bottom.
As seen in Figure 3a the maximal impact was quite unstable in the beginning, while few persistently influential
communities like H ELP D ESK, F EEDBACK, and M ODER ATORS had emerged later on. In the early periods of the system computer- and game-related fora like ROLE -P LAYING,
G AMES, W EBGAMES, and C OMPUTERS & T ECHNOLOGY
had a very high impact. Taking into account that Boards.ie
was originally set-up as a discussion system for players of
computer games, it is natural these communities appeared as
highly influential. Over the time, however, the maximal importance appeared lower in general as indicated by the transition from green to violet in the heatmap. In fact, the mean
maximal impact of the upper part of the heatmap (early
periods) from fora ROLE - PLAYING to R EAVER was 0.15,
compared with 0.03 of the lower part (later periods) from
T HE I LLUMINATTI to PBAN. Considering that the values
are normalised, it indicates the impact have become more
distributed over the time. The emergence of the persistently
influential fora H ELP D ESK (weeks 100–310), F EEDBACK
(110–448), and M ODERATORS (140–448) suggests that in
fact they were established by highly influential users from
the early important communities like W EBGAMES or C OM PUTERS & T ECHNOLOGY . However, in order to test that hypothesis, it is necessary to investigate activity of individual
users, which is beyond the scope of this paper.
Figure 3b shows a less dispersed picture, with initially
Q UAKE having high dependency values but with A FTER
H OURS clearly dominating from about week 25. This suggests that one of the first forum of the system altogether,
Q UAKE, served not only as a place to discuss the at the time
popular computer game, but that its highly central users were
participating a lot in other communities as well. In contrast
with the early weeks the maximal dependence values de-
Table 4: Number (size) of the dependence-based clusters and the
average group in-degree, number of active users, number of posts,
and importance. The maximal values are in bold.
Column-based clustering: Dependence On the contrary,
we found that the dependence-based clusters show a different structure. The clusters in Figure 2b show these communities plotted against their logarithmically-scaled dependence
and entropy. Please note that again the clusters follow the
dependence and its entropy even though the latter was not
used for the clustering itself. Table 4 contains several statistics characterising the dependence-based clusters. A FTER
H OURS was the only member of cluster I with the highest
average dependence, which is more than five-times higher
than the second highest figure. Moreover, its dependence
has high entropy, which means it is influenced by many
other communities. Hence this community has been identified what it indeed is — a common meeting place of members of disparate communities, while lacking a strong kernel
of fully devoted users. The simple activity-based measures
thus cannot capture such character, because judging only by
activity or user-base volumes A FTER H OURS would be the
most influential forum (see Table 5). This raises the question
as to whether this community is in fact rather weak, because
its users come only to chat, while their true interests lay in
other fora.
While the average dependence of cluster III is the lowest, it can be ascribed to the low activity and user base of
its communities rather than their particular strength. Cluster
III is therefore analogous to the importance-based cluster 2
since it represents the majority of the system. In fact, both
clusters are highly overlapping as their Jaccard similarity is
0.74. Many general-topic fora are represented by cluster II:
H UMOUR, P ERSONAL I SSUES, or F EEDBACK. This means
that these communities are not only influencing significantly
others as we described in the previous paragraph, but they
are also influenced significantly. In order to disentangle the
concrete mutual impact between these communities and others, it is necessary to drill down in the analysis to the level
of time-series of the impact, which is a subject of the next
section.
Overall Importance and Dependence over Time
7
Graphs with the full list of fora which have had highest respective values at least once can be found in the supplementary
material.
To determine the distribution of impact and dependency over
time we plotted fora with the highest importance (depen-
39
After Hours
Quake
Half Life
Computers & Tech
Humanities
Humour
Counter Strike
Help Desk
IrelandOffline
Pol tics
Color Key
0
0 05
01
0 15
Week 425
Week 400
Week 375
Week 350
Week 325
Week 300
Week 275
Week 250
Week 225
Week 200
Week 175
Week 150
Week 125
Week 75
Week 100
Week 50
Week 1
Week 25
Soccer
Week 425
Week 400
Week 375
Week 350
Week 325
Week 300
Week 275
Week 250
Week 225
Week 200
Week 175
Week 150
Week 125
Week 75
Week 100
Week 50
Week 1
Week 25
Role Playing
Films
Games
Computers & Tech
Sports
After Hours
Literature
Work & Jobs
Webgames
Humanities
Recycle Bin
Humour
Television
Reaver
Help Desk
Science
Feedback
Newbies & FAQ
Freemasons
Moderators
Comeonbanus
Lord of the Rings
PearTree House
History & Heritage
Digital Art & Design
The Illuminati
FNWAI
Tipp Inst
The Thunderdome
HoLL
Ask Doctor Demento
Lubnip
The Cuckoo's Nest
Events
Spe l Czechs
Knights of the R T
PBAN
Color Key
02
0 25
03
0
02
Value
04
06
08
Value
(a) most important fora over time
(b) most dependent fora over time
Figure 3: Heatmaps of fora with highest importance and dependence over time.
Table 6 shows the top four impact counts from Ψ. It
can be seen that this reflects our initial findings that
M ODERATORS and T HE T HUNDERDOME were amongst
the most influential fora, and that A FTER H OURS and
P ERSONAL I SSUES were the ones which receive the most
impact from other fora. We also see, that while M ODER ATORS was affecting primarily R EPORTED P OSTS which
was concerned with malicious behaviour of the users, T HE
T HUNDERDOME was primarily affecting A FTER H OURS.
Recall that T HE T HUNDERDOME is centred around mutual insults of its participants, and apparently these users
successfully trigger high activity in other fora like A FTER
H OURS.
creased later on to the mean value about 0.12 from week
325 onwards, when A FTER H OURS emerged as the most dependent forum. Similarly to the distribution of importance,
it means that dependency became more dispersed over time.
Moreover, whereas the average ratio of dependence (Eq. 3)
and independence (self-impact) for Q UAKE was 2 between
weeks 1–25, the same figure was more than six-times higher
for A FTER H OURS in weeks 25–448. Therefore, it suggests
Q UAKE had a stronger core of its members in contrast with
the over-arching A FTER H OURS, which emerged as a popular meeting point for users of many different communities.
We can also see that a once important community can increasingly become dependent as in the case of C OMPUTERS
& T ECHNOLOGY, which was 6 times the most influential
between weeks 5–26, but then was identified 18 times as the
most dependent between weeks 47–122.
# impact (Ψi,j )
29
22
17
14
Cross-Community Influence over Time
So far we have investigated which fora are similar with respect to their overall importance (dependence), or how the
most influential (dependent) communities emerged over the
time; but, we can drill down even more to the level of concrete pairs of communities and inspect which communities
were influencing a given community the most and at what
time. To first get an idea of which pairs were highly related
with respect to the high influence one community had on
the other, we took an aggregate matrix Ψ whose elements
express how many times i-th community had a significant
impact (see Eq. 4) on j-th over the full time span:
Ψi,j =
448
ψ(i, j, Ĵt )
from (i)
M ODERATORS
FNWAI
T HE T HUNDERDOME
PI M ODS
to (j)
R EPORTED P OSTS
P OKER
A FTER H OURS
P ERSONAL I SSUES
Table 6: Top 4 counts from the aggregate impact matrix Ψ.
One of the highly influenced communities listed in Table 6 is P ERSONAL I SSUES. Apart from the highly influencing PI M ODS consisting of moderators dedicated particularly to that community, other fora like PARENTING, S EX
& S EXUALITY, or M ODERATORS were also found to be influential, but less frequently. P ERSONAL I SSUES is arguably
of high importance for many users because it offers them
a discreet opportunity to seek advice or help in many difficult real-life situations like alcoholism, domestic violence,
or unemployment. Clearly, such discussion needs to be protected from unhelpful comments. Therefore it is natural that
we have observed five significant impact values (see Eq. 4)
from M ODERATORS between weeks 151 and 246, as illus-
(6)
t=1
40
7
trated by Figure 4. From week 247 onwards there were no
further significant impact values identified which means that
influence of M ODERATORS on P ERSONAL I SSUES lowered.
However, that does not mean the forum stopped to be moderated, because a specifically-dedicated community of moderators PI M ODS was found to have a significant impact in
14 cases from week 299 until the end of the analysed data.
communities with respect to a particular topic. It may also
shed some light on whether there is such a phenomenon as
influence polarity or whether influence from one community
to another may be beneficial or negative and disruptive.
Acknowledgments
The research presented is jointly supported by the Science Foundation Ireland under Grant No. SFI/08/CE/I1380
(Lion-2) and under Grant No. 08/SRC/I1407 (Clique: Graph
& Network Analysis Cluster), and by the EU under Grant
No. 257859 (ROBUST).
●
6
PI Mods
Moderators
independence
●
References
5
●
4
●
Arguello, J.; Butler, B.; Joyce, E.; Kraut, R.; Ling, K.; Rosé, C.; and
Wang, X. 2006. Talk to me: Foundations for successful individualgroup interactions in online communities. In Proceedings of the
SIGCHI conference on Human Factors in computing systems, 959–
968. ACM.
Everett, M., and Borgatti, S. 1999. The centrality of groups and
classes. Journal of Mathematical Sociology 23(3):181–201.
Fortunato, S. 2010. Community detection in graphs. Physics Reports 486(3-5):75–174.
Gregory, S. 2011. Fuzzy overlapping communities in networks. Journal of Statistical Mechanics: Theory and Experiment
2011:P02017.
Kempe, D.; Kleinberg, J.; and Tardos, É. 2003. Maximizing the
spread of influence through a social network. In Proceedings of
the ninth ACM SIGKDD international conference on Knowledge
discovery and data mining, 137–146. ACM.
Kumar, R.; Mahdian, M.; and McGlohon, M. 2010. Dynamics
of conversations. In Proceedings of the 16th ACM SIGKDD international conference on Knowledge discovery and data mining,
553–562. ACM.
McGlohon, M., and Hurst, M. 2009. Community structure and
information flow in USENET: Improving analysis with a thread
ownership model. In International Conference on Weblogs and
Social Media (ICWSM).
Palla, G.; Derényi, I.; Farkas, I.; and Vicsek, T. 2005. Uncovering the overlapping community structure of complex networks in
nature and society. Nature 435(7043):814–818.
Pollner, P.; Palla, G.; and Vicsek, T. 2006. Preferential attachment
of communities: The same principle, but a higher level. EPL (Europhysics Letters) 73:478.
Spiliopoulou, M. 2011. Social Network Data Analytics. Springer.
chapter Evolution in Social Networks: A Survey, 149–175.
Sun, J., and Tang, J. 2011. Social Network Data Analytics.
Springer. chapter A survey of models and algorithms for social
influence analysis, 177–214.
Sun, T.; Chen, W.; Liu, Z.; Wang, Y.; Sun, X.; Zhang, M.; and Lin,
C. 2011. Participation maximization based on social influence in
online discussion forums. In International Conference on Weblogs
and Social Media (ICWSM).
Wasserman, S., and Faust, K. 2009. Social network analysis: Methods and applications. Cambridge University Press.
Whittaker, S.; Terveen, L.; Hill, W.; and Cherny, L. 1998. The dynamics of mass interaction. In Proceedings of the 1998 ACM conference on Computer supported cooperative work, 257–264. ACM.
Zadeh, L. 1983. A computational approach to fuzzy quantifiers
in natural languages. Computers & Mathematics with Applications
9(1):149–184.
●
●
impact
●
●
●
3
●
●
0
1
2
●
150
200
250
300
350
400
450
week
Figure 4: Impact of M ODERATORS and PI M ODS on P ERSONAL
I SSUES, and its independence (self-impact) over the time. The significant impact from M ODERATORS and PI M ODS are emphasised
by triangles and circles respectively.
The time-series of cross-community impact thus clearly
identified which were the key influencers and how they impacted a given community over time. We have investigated
other relations between fora from Table 6, like the impact
from FNWAI (Fold, No, Wait, All In) to P OKER, and since
the time-series evolve similarly, we omit them for space reasons.
Conclusion
We have formalised a flexible and scalable framework for
the analysis of cross-community influence. We have demonstrated its efficacy on the Boards.ie data-set to determine
communities that are highly influential to other communities, or, conversely, communities highly dependent on others. We demonstrated cross-community influence phenomena such as global patterns of influence/dependence obtained by a cluster analysis and individual communities with
strong mutual influence over time.
However, we believe that this is just a first step towards a
fully systematic analysis of cross-community influence. For
instance, we believe that the measures of cross-community
influence and its entropy can be used for selection of target communities in order to maximise the spread of influence/information (Kempe, Kleinberg, and Tardos 2003).
Another fertile direction is to enrich the structural influence analysis with complementary information like topics or
sentiment mined from the content associated with the communities. This may enable the identification of important
41


