Commodity Sheet Data Turkeys
advertisement
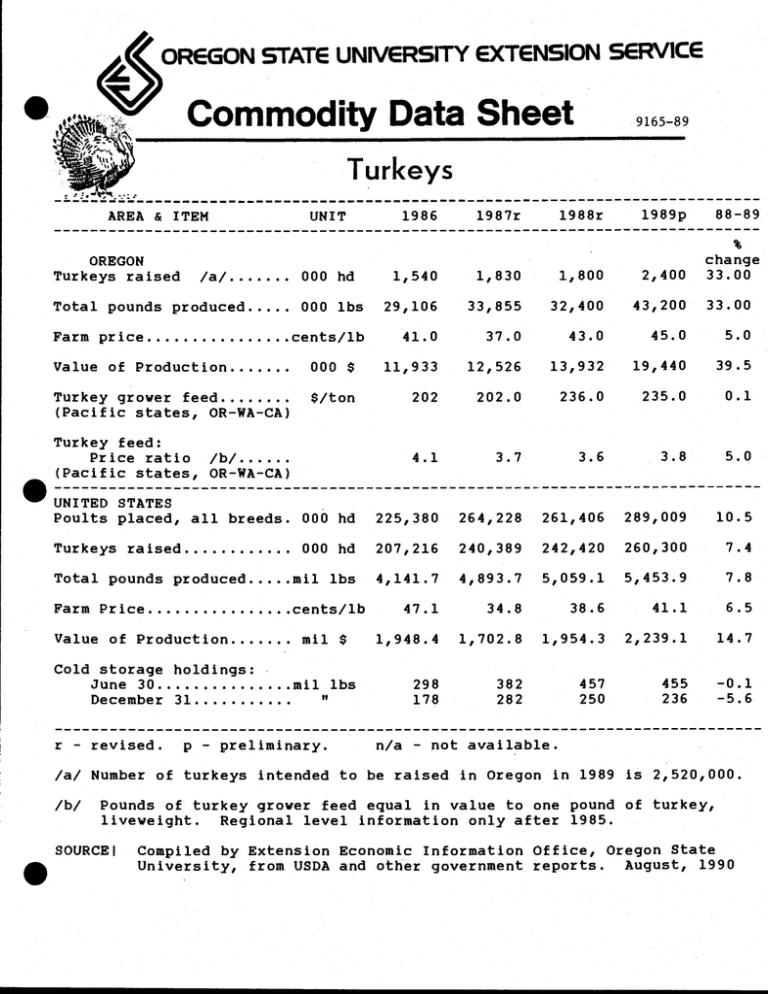
OREGON STATE UNIVERSITY EXTENSION SERVICE Commodity Data Sheet 9165 -89 Turkeys AREA & UNIT ITEM 1986 1988r 1987r 1989p 88 -89 change 33.00 S OREGON Turkeys raised /a/ Total pounds produced Farm price 1,540 1,830 1,800 2,400 000 lbs 29,106 33,855 32,400 43,200 33.00 cents /lb 41.0 37.0 43.0 45.0 5.0 000 hd Value of Production 000 $ 11,933 12,526 13,932 19,440 39.5 Turkey grower feed (Pacific states, OR- WA -CA) $ /ton 202 202.0 236.0 235.0 0.1 4.1 3.7 3.6 3.8 5.0 Turkey feed: Price ratio /b/ (Pacific states, OR- WA -CA) UNITED STATES Poults placed, all breeds 000 hd 225,380 264,228 261,406 289,009 10.5 Turkeys raised 000 hd 207,216 240,389 242,420 260,300 7.4 Total pounds produced mil lbs 4,141.7 4,893.7 5,059.1 5,453.9 7.8 Farm Price cents /lb 47.1 34.8 38.6 41.1 6.5 1,948.4 1,702.8 1,954.3 2,239.1 14.7 298 178 382 282 457 250 455 236 -0.1 -5.6 Value of Production Cold storage holdings: June 30 December 31 r - revised. p - mil $ mil lbs " preliminary. n/a - not available. /a/ Number of turkeys intended to be raised in Oregon in 1989 is 2,520,000. /b/ Pounds of turkey grower feed equal in value to one pound of turkey, liveweight. Regional level information only after 1985. SOURCE, Compiled by Extension Economic Information Office, Oregon State August, 1990 University, from USDA and other government reports. VALUE OF TURKEYS SOLD, BY COUNTIES. OREGON County 1984 -1989p 1985 1986 506 1 ,,289 2 89 448 894 411 904 387 696 454 972 10,257 10,559 11,183 12,815 15,550 38 32 28 34 34 12,090 11,933 12,526 13,932 17,010 1987 1988 1989p thousand dollars Clackamas Polk Yamhill Other counties... . . . . . . . . . . . . STATE TOTAL TURKEYS: OREGON. 1955 -1989p Price per pound Breeder hens Year Number raised 1955 1,535 cents /lb 27.9 (000 $) 7,638 1960 1,415 25.2 6,698 1965 1966 1967 1968 1969 1,545 1,752 1,988 1,937 1,796 22.4 23.3 19.5 21.2 24.6 6,262 7,681 6,800 7,721 8,378 23.5 23.0 22.0 44.5 32.3 9,315 1974 ............. 2,178 1,750 1,400 1,400 1,225 7,366 5,729 10,342 7,637 1975 ........... 1976 ............. 1977 1978 1979 1,075 1,300 1,350 1,275 1,295 39.0 34.0 35.8 46.7 42.0 7,756 7,779 8,603 11,551 10,552 1980 1981 1982 1983 1984 1,170 1,400 1,050 810 900 45.0 37.0 48.0 40.0 44.0 10,004 9,583 9,526 6,318 7,484 n/a n/a n/a 1,300 1,540 1,830 1,800 2,400 50.0 41.0 37.0 43.0 45.0 12,090 11,933 12,526 13,932 19,440 n/a n/a n/a n/a n/a (000) " 1970 1971 1972 1973 .......... ` . 1985 1986 1987 1988 1989p n/a not available as of December * Inventory 1, Rec. from mktings (000) 210 170 200 244 245 184 181 167 144* 130* 125* 100* 70* 60* 45* 63* 74* 59* 36* r - revised, p - preliminary of the previous year. Source: Compiled by Extension Economic Information Office, Oregon State University. Stanley D. Miles, Extension Economist. August, 1990 .
