Proceedings of the Twenty-Seventh AAAI Conference on Artificial Intelligence
Imbalanced Multiple Noisy Labeling for Supervised Learning
Jing Zhang1, Xindong Wu1,2, Victor S. Sheng3
1
Department of Computer Science, Hefei University of Technology, Hefei, P.R. China
Department of Computer Science, University of Vermont, Burlington, VT 05405, USA
Department of Computer Science, University of Central Arkansas, Conway, AR 72035, USA
jingzhang.cs@gmail.com, xwu@cs.uvm.edu, ssheng@uca.edu
2
3
imbalanced, the number of negative labels obtained is far
more than that of positive labels. If MV is applied, it will
make negative examples outnumber positive ones,
resulting in an imbalanced class distribution in the final
training set, even if the true distribution is balanced.
Extremely, the training set might contain no positive
examples.
Besides MV, other approaches have been proposed.
Snow et al. (2008) proposed a simple Naive Bayes (NB)
approach to construct a weighted ensemble for consensus
labeling. Raykar et al. (2010) modeled label expertise via
the EM algorithm to predict underlying labels. Yan et al.
(2011) proposed a semi-supervised approach to model
multiple noisy annotators. All these methods require prior
information such as prior knowledge about each labeler or
difficulty of each example. In real-world applications, this
is truly a chicken-and-egg problem when the tasks start up
on the Internet.
We propose an agnostic algorithm PLAT to use skewed
noisy labels to induce an integrated label for each example.
It solves the problem that minority examples (assuming
positive cases) in the training set occur rarely, because of
imbalanced noisy labeling.
Abstract
When labeling objects via Internet-based outsourcing
systems, the labelers may have bias, because they lack
expertise, dedication and personal preference. These reasons
cause Imbalanced Multiple Noisy Labeling. To deal with the
imbalance labeling issue, we propose an agnostic algorithm
PLAT (Positive LAbel frequency Threshold) which does
not need any information about quality of labelers and
underlying class distribution. Simulations on eight realworld datasets with different underlying class distributions
demonstrate that PLAT not only effectively deals with the
imbalanced multiple noisy labeling problem that off-theshelf agnostic methods cannot cope with, but also performs
nearly the same as majority voting under the circumstances
that labelers have no bias.
Introduction
Online outsourcing systems, such as Amazon’s Mechanical
Turk, allow multiple human labelers to label the same
objects efficiently. However, the quality of labels cannot
be guaranteed. Facing noisy labels, it is usual to obtain
multiple labels for some or all data points. A preliminary
study (Sheng, Provost and Ipeirotis 2008) discussed a
straightforward strategy of using multiple noisy labels
majority voting (MV). Their work implicitly assumed that
mislabeling is uniformly distributed across the entire data
points, and concluded that as long as the labeling quality is
greater than 50%, the eventual integrated labeling quality
and the performance of the model learned are improved if
more repeated labels are obtained.
However, the reality is that mislabeling is usually not
uniformly distributed. Due to lack of expert knowledge,
most labelers tend to make shallow determination by
common sense or simply repeat what others say. Taking
binary classification for example, it is not unusual that
labeling on minority examples is error-prone. In this study,
we treat minority as the positive class. When labeling is
Problem statement
We assume that a data set contains a proportion d of true
positive examples and 1-d of true negative examples. d =
0.5 indicates the underlying class distribution is completely
is introduced to control the
balanced. A variable
percentage of mislabeling on the positive data points. It
reflects the level of imbalanced labeling, the larger the
higher level of imbalance. If all labelers have the same
overall labeling quality p which can be treated as the
integration of the labeling quality on positive examples (pp),
and pn on negative examples, we calculate pp = (d+Vp-V)/d
and pn = (p+V-Vp-d)/(1-d). When MV is applied, the
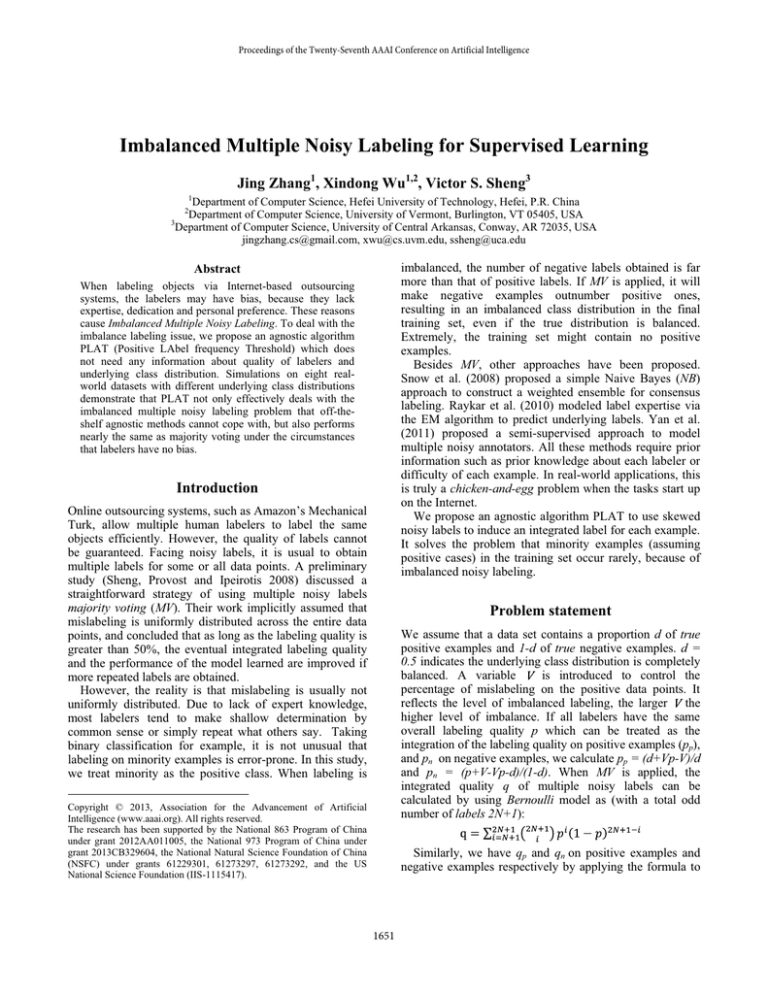
integrated quality q of multiple noisy labels can be
calculated by using Bernoulli model as (with a total odd
number of labels 2N+1):
Copyright © 2013, Association for the Advancement of Artificial
Intelligence (www.aaai.org). All rights reserved.
The research has been supported by the National 863 Program of China
under grant 2012AA011005, the National 973 Program of China under
grant 2013CB329604, the National Natural Science Foundation of China
(NSFC) under grants 61229301, 61273297, 61273292, and the US
National Science Foundation (IIS-1115417).
Similarly, we have qp and qn on positive examples and
negative examples respectively by applying the formula to
1651
We compared our approach with MV and its two variants
MV_Beta and Pairwise_Beta proposed by (Sheng 2011) on
eight real-world datasets with different d values collected
from the UCI database repository. We conducted the
simulation using J48 in WEKA (Witten and Frank 2005).
We show accuracy results on four of these eight datasets
under different settings in Figure 2. Our approach is
superior to the three off-the-shelf methods.
pp and pn. Then we calculate the ratio of the number of
“labeled” positive examples (Np) and that of “labeled”
negative examples (Nn) as follows:
α = Np/Nn = [dqp+(1-d)(1-qn )] / [(1-d)qn+d(1-qp)]
For example, supposing the underlying class distribution
is completely balanced (d = 0.5) and V = 0.8, if 0.5 < p <
0.7, α decreases as the number of labels increases when MV
is applied. With the reduction of α, the number of positive
examples in the final training set declines, which will
eventually reduce the learning model accuracy. Theoretical
analysis shows if(1) the quality of labeling is quite low (0.5
≤ p ≤ 0.7) and (2) the imbalance labeling level is significant
(0.7 ≤ V ≤ 1.0), MV does not work at all with imbalanced
multiple noisy labeling. If the underlying class distribution
is imbalanced, the result will be even worse.
100
90 d=0.482
80
70
60
PLAT
PWBeta
MVBeta
MV
50
Accuracy (%)
Accuracy (%)
100
1
5
9
13
17
21
# labels (mushroom V=0.8 p=0.6)
PLAT Algorithm and Experiments
Number of examples
1500
Accuracy (%)
Accuracy (%)
60
We have comprehensively investigated the performance of
PLAT under different circumstances: balanced or
imbalanced labeling, potentially balanced or imbalanced
class distributions, and/or labelers with different labeling
qualities. Experimental results have shown that it always
performs effectively. In the future, we will further study
how to handle the imbalance labeling of multi-class
classification and how to apply PLAT to active learning of
imbalanced repeated labeling.
References
Raykar, V. C., Yu, S., Zhao, L. H., Florin, C., Valadez, G. H.,
Bogoni, L., and Moy, L. 2010. Learning from crowds. Journal of
Machine Learning Research 11(Apr), 1297-1322.
Sheng, V. S., Provost, F., and Ipeirotis, P. 2008. Get Another
Label? Improving Data Quality and Data Mining Using Multiple,
Noisy Labeler. ACM SIGKDD 2008, 614-662.
Sheng, V. S. 2011. Simple Multiple Noisy Label Utilization
Strategies. IEEE ICDM 2011, 635-644.
Snow, R., O'Connor, B., Jurafsky, D., and Ng, A. 2008. Cheap
and fast—but is it good? EMNLP 2008, 254–263.
Witten, I. H., and Frank, E. 2005. Data Mining: Practical
Machine Learning Tools and Techniques, 2nd ed. Morgan
Kaufman Publishing, June 2005.
Yan, Y., Rosales, R., Fung, G., and Dy, J. 2010. Modeling
Multiple Annotator Expertise in the Semi-Supervised Learning
Scenario. UAI 2010, 674–682.
the mushroom dateset
(+)2678 (-)3008
valley
T 0.4
0.2
0.6
0.8
Proportion of positive labels (+)
70
Conclusion
500
0
d=0.394
80
Figure 2. Accuracy of different utilization methods
peak2
peak1
50
50
1
5
9
13 17 21
1
5
9
13 17 21
# labels (mushclean1 V=0.8 p=0.6) # labels (spambase V=0.8 p=0.6)
p=0.70
p=0.55
1000
60
60
50
2000
peak
70
70
90
d=0.435
80
80
1
5
9
13
17
21
# labels (kr-vs-kp V=0.8 p=0.6)
90
Our approach, based on the distribution of positive labels
in the multiple noisy label set of each example, is to
dynamically determine the threshold that can make the
ratio of the numbers of positive and negative examples in
the integrated training set close to the underlying class
distribution of the dataset. We first calculate the frequency
of positive labels (denoted by f+) of each multiple label set.
Then we group the examples with the same and almost the
same f+ values. Due to the imbalance, the labeling qualities
on two classes are different. Given an example with the
true positive label, the number of positive labels obeys the
binomial distribution B(N, pp). Similarly, for a true
negative example, the number of positive labels obeys B(N,
1-pn). With these two distributions and the numbers of
examples in different f+s, we propose an approach PLAT
(Positive LAbel frequency Threshold) to estimate a
threshold T. If we plot the number of examples with the
same f+ as Figure 1 illustrates, we will find (1) two peaks
when pp and 1-pn are significantly different, which stand
for the centers of positive and negative examples
respectively; (2) only one peak when pp and 1-pn are nearly
the same. Correspondingly, we can choose (1) the valley
between two peaks, or (2) the only peak as the estimated T
value. PLAT uses the threshold T to determine the
integrated labels of training examples.
d=0.478
90
1
Figure 1. The distribution of examples with different
proportions of positive labels under different labeling qualities p
1652

