Who’s Calling? Demographics of Mobile Phone Use in Rwanda
Joshua E. Blumenstock
Dan Gillick
Nathan Eagle
UC Berkeley
School of Information
jblumenstock@berkeley.edu
UC Berkeley
Computer Science Division
dgillick@cs.berkeley.edu
Santa Fe Institute
nathan@santafe.edu
Abstract
Demographics of Phone Ownership and Use
We describe how new sources of data can be used to better
understand the demographic structure of the population of
Rwandan mobile phone users. After combining anonymous
call data records with follow-up phone interviews, we detect
significant differences in phone usage among different social
and economic subgroups of the population. However, initial
experiments suggest that predicting demographics from call
usage, and vice-versa, is quite difficult.
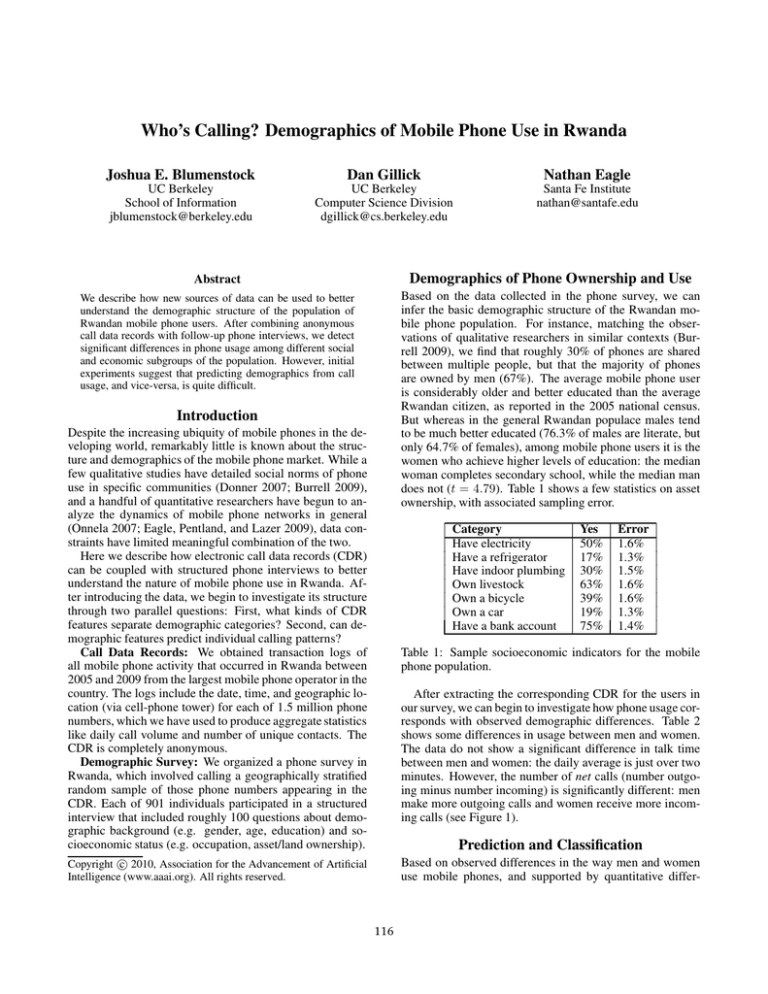
Based on the data collected in the phone survey, we can
infer the basic demographic structure of the Rwandan mobile phone population. For instance, matching the observations of qualitative researchers in similar contexts (Burrell 2009), we find that roughly 30% of phones are shared
between multiple people, but that the majority of phones
are owned by men (67%). The average mobile phone user
is considerably older and better educated than the average
Rwandan citizen, as reported in the 2005 national census.
But whereas in the general Rwandan populace males tend
to be much better educated (76.3% of males are literate, but
only 64.7% of females), among mobile phone users it is the
women who achieve higher levels of education: the median
woman completes secondary school, while the median man
does not (t = 4.79). Table 1 shows a few statistics on asset
ownership, with associated sampling error.
Introduction
Despite the increasing ubiquity of mobile phones in the developing world, remarkably little is known about the structure and demographics of the mobile phone market. While a
few qualitative studies have detailed social norms of phone
use in specific communities (Donner 2007; Burrell 2009),
and a handful of quantitative researchers have begun to analyze the dynamics of mobile phone networks in general
(Onnela 2007; Eagle, Pentland, and Lazer 2009), data constraints have limited meaningful combination of the two.
Here we describe how electronic call data records (CDR)
can be coupled with structured phone interviews to better
understand the nature of mobile phone use in Rwanda. After introducing the data, we begin to investigate its structure
through two parallel questions: First, what kinds of CDR
features separate demographic categories? Second, can demographic features predict individual calling patterns?
Call Data Records: We obtained transaction logs of
all mobile phone activity that occurred in Rwanda between
2005 and 2009 from the largest mobile phone operator in the
country. The logs include the date, time, and geographic location (via cell-phone tower) for each of 1.5 million phone
numbers, which we have used to produce aggregate statistics
like daily call volume and number of unique contacts. The
CDR is completely anonymous.
Demographic Survey: We organized a phone survey in
Rwanda, which involved calling a geographically stratified
random sample of those phone numbers appearing in the
CDR. Each of 901 individuals participated in a structured
interview that included roughly 100 questions about demographic background (e.g. gender, age, education) and socioeconomic status (e.g. occupation, asset/land ownership).
Category
Have electricity
Have a refrigerator
Have indoor plumbing
Own livestock
Own a bicycle
Own a car
Have a bank account
Yes
50%
17%
30%
63%
39%
19%
75%
Error
1.6%
1.3%
1.5%
1.6%
1.6%
1.3%
1.4%
Table 1: Sample socioeconomic indicators for the mobile
phone population.
After extracting the corresponding CDR for the users in
our survey, we can begin to investigate how phone usage corresponds with observed demographic differences. Table 2
shows some differences in usage between men and women.
The data do not show a significant difference in talk time
between men and women: the daily average is just over two
minutes. However, the number of net calls (number outgoing minus number incoming) is significantly different: men
make more outgoing calls and women receive more incoming calls (see Figure 1).
Prediction and Classification
c 2010, Association for the Advancement of Artificial
Copyright Intelligence (www.aaai.org). All rights reserved.
Based on observed differences in the way men and women
use mobile phones, and supported by quantitative differ-
116
Calling behavior
Total call duration
Net call duration (out - in)
Int’l call duration
Number of calls
Net number of calls
Number of unique contacts
Men
2.21
0.14
0.08
4.83
0.23
2.94
Women
2.41
-0.19
0.13
4.66
-0.18
2.76
p-value
0.3491
0.0004
0.0586
0.5768
0.0045
0.2979
We also tried to predict individual daily call time from the
survey data, using the same bootstrapping setup described
above. Table 3 shows the predictive power of various features in a linear regression model. We had a bit more success
here, perhaps because we could leverage the features that indicate economic status: having electricity and a refrigerator
both suggest some wealth, for example. Users based near
Kigali (the capital) tended to talk more, as did those with
some means of transportation. Still, the model’s error rate
is very high. There is tremendous variance in average talk
time, only a small fraction of which can be explained by demographic features.
Table 2: Differences in phone usage by gender. Daily averages reported; durations are in minutes.
Features
Mean (baseline)
Geographic Regions
Education Levels
Age + Gender
Working Days
Transportation
Radio + TV
Electricity
Refrigerator
Bank Account
Best combination
Distribution density
Men
Women
Both
Error (RMSE)
33.0
32.3
32.8
33.0
33.0
32.2
32.0
31.7
31.9
33.0
30.9
Gain (%)
NA
+2.5%
+1.0%
+0.1%
0.0%
+2.5%
+3.0%
+4.3%
+4.0%
0.0%
+6.6%
Table 3: Using a linear model to predict each user’s daily
talk time. The mean is 2.1 minutes; Root Mean Squared
Error (RMSE) in minutes is shown along with relative improvement over the “guess the mean” baseline.
−200
−100
0
100
200
Net outgoing seconds per day
Conclusion
This work presents a preliminary analysis of two new
sources of data on mobile phone use in Rwanda. We
find striking differences in phone use for different groups
of people. However, predicting phone usage from sociodemographic data, and vice versa, proves quite difficult. In
the future, we hope that decoding mobile phone network
data will further illuminate underlying social and economic
interactions.
Figure 1: Net outgoing call time per day, by gender.
ences reported in Table 2, we thought it might be possible
to infer gender (and other demographic attributes) based on
CDR data alone. We trained a logistic regression model
from 80% of the data and tested on the remaining 20%.
Each experiment was repeated 1000 times with randomized
train/test splits.
The best model, which included five of the most important CDR features, gave 74% accuracy, a small improvement
over the baseline (guessing the majority class gives 71%).
Further attempts at classification by creating features to describe individual calls and sequences of two or three calls
were not any more successful. Similar results were obtained
using a Naive Bayes classifier and a Support Vector Machine
(SVM) classifier.
Why such marginal results? It seems likely, in hindsight,
that gender effects are dominated by more overt economic
factors. The average call is only 27 seconds, and the average
daily talk time is just over two minutes, reflecting the pressure of pay-per-minute phone plans that cost roughly $0.25
(U.S.) per minute. More generally, CDR features account
for only a tiny fraction of the variance in each demographic
group, which makes classification difficult.
References
Burrell, J. 2009. Evaluating Shared Access: social equality
and the circulation of mobile phones in rural Uganda. Journal of Computer-Mediated Communication Forthcoming.
Donner, J. 2007. The Use of Mobile Phones by Microentrepreneurs in Kigali, Rwanda: Changes to Social and
Business Networks. Information Technologies and International Development 3(2):3–19.
Eagle, N.; Pentland, A.; and Lazer, D. 2009. Inferring friendship network structure by using mobile phone
data. Proceedings of the National Academy of Sciences
106(36):15274–15278.
Onnela, J. 2007. Structure and tie strengths in mobile
communication networks. Proceedings of the National
Academy of Sciences 104(18):7332–7336.
117


