2007 Extension Research Report Disease Management FUNGICIDES FOR CONTROL OF PHYTOPHTHORA CAPSICI
advertisement
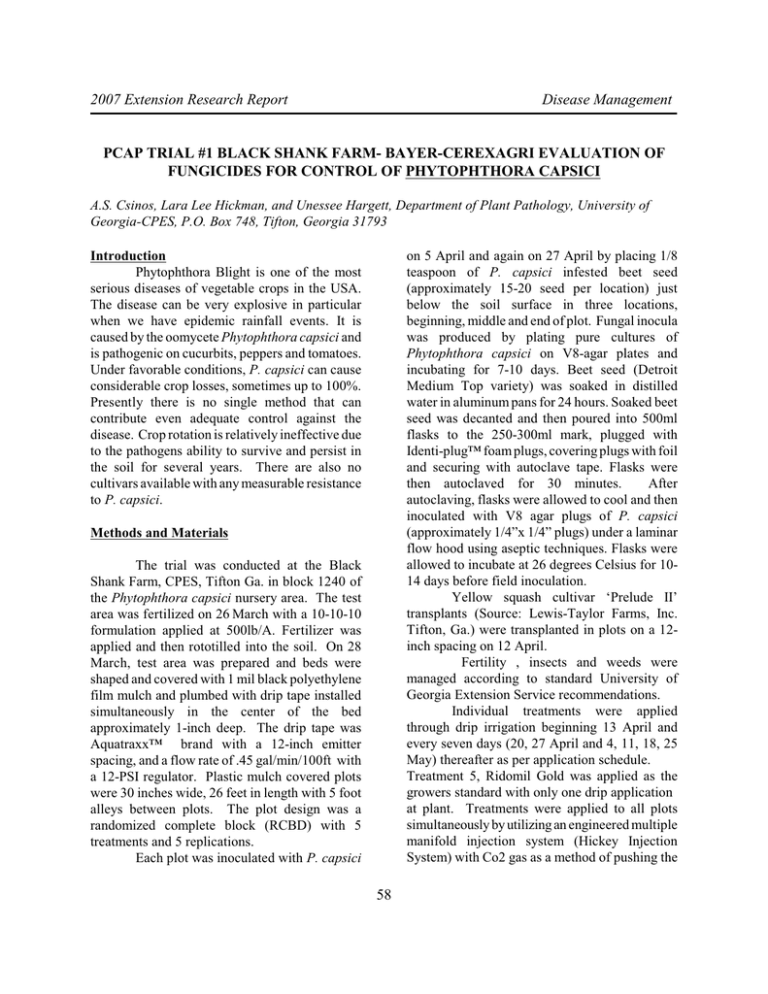
2007 Extension Research Report Disease Management PCAP TRIAL #1 BLACK SHANK FARM- BAYER-CEREXAGRI EVALUATION OF FUNGICIDES FOR CONTROL OF PHYTOPHTHORA CAPSICI A.S. Csinos, Lara Lee Hickman, and Unessee Hargett, Department of Plant Pathology, University of Georgia-CPES, P.O. Box 748, Tifton, Georgia 31793 on 5 April and again on 27 April by placing 1/8 teaspoon of P. capsici infested beet seed (approximately 15-20 seed per location) just below the soil surface in three locations, beginning, middle and end of plot. Fungal inocula was produced by plating pure cultures of Phytophthora capsici on V8-agar plates and incubating for 7-10 days. Beet seed (Detroit Medium Top variety) was soaked in distilled water in aluminum pans for 24 hours. Soaked beet seed was decanted and then poured into 500ml flasks to the 250-300ml mark, plugged with Identi-plug™ foam plugs, covering plugs with foil and securing with autoclave tape. Flasks were then autoclaved for 30 minutes. After autoclaving, flasks were allowed to cool and then inoculated with V8 agar plugs of P. capsici (approximately 1/4”x 1/4” plugs) under a laminar flow hood using aseptic techniques. Flasks were allowed to incubate at 26 degrees Celsius for 1014 days before field inoculation. Yellow squash cultivar ‘Prelude II’ transplants (Source: Lewis-Taylor Farms, Inc. Tifton, Ga.) were transplanted in plots on a 12inch spacing on 12 April. Fertility , insects and weeds were managed according to standard University of Georgia Extension Service recommendations. Individual treatments were applied through drip irrigation beginning 13 April and every seven days (20, 27 April and 4, 11, 18, 25 May) thereafter as per application schedule. Treatment 5, Ridomil Gold was applied as the growers standard with only one drip application at plant. Treatments were applied to all plots simultaneously by utilizing an engineered multiple manifold injection system (Hickey Injection System) with Co2 gas as a method of pushing the Introduction Phytophthora Blight is one of the most serious diseases of vegetable crops in the USA. The disease can be very explosive in particular when we have epidemic rainfall events. It is caused by the oomycete Phytophthora capsici and is pathogenic on cucurbits, peppers and tomatoes. Under favorable conditions, P. capsici can cause considerable crop losses, sometimes up to 100%. Presently there is no single method that can contribute even adequate control against the disease. Crop rotation is relatively ineffective due to the pathogens ability to survive and persist in the soil for several years. There are also no cultivars available with any measurable resistance to P. capsici. Methods and Materials The trial was conducted at the Black Shank Farm, CPES, Tifton Ga. in block 1240 of the Phytophthora capsici nursery area. The test area was fertilized on 26 March with a 10-10-10 formulation applied at 500lb/A. Fertilizer was applied and then rototilled into the soil. On 28 March, test area was prepared and beds were shaped and covered with 1 mil black polyethylene film mulch and plumbed with drip tape installed simultaneously in the center of the bed approximately 1-inch deep. The drip tape was Aquatraxx™ brand with a 12-inch emitter spacing, and a flow rate of .45 gal/min/100ft with a 12-PSI regulator. Plastic mulch covered plots were 30 inches wide, 26 feet in length with 5 foot alleys between plots. The plot design was a randomized complete block (RCBD) with 5 treatments and 5 replications. Each plot was inoculated with P. capsici 58 candidate chemical through drip irrigation tape. The Hickey injection system was developed at the Black Shank Farm, Tifton, Ga. by farm manager Don Hickey and research coordinator Lewis Mullis in order to develop a more efficient and timely treatment application method for use in onfarm chemical trials. Rainfall amount for the period of April 1st through June 1st only amounted to 4.53 inches within a total of 11 days of rain. Therefore, all plots began receiving daily overhead irrigation (approximately 1-inch of water per irrigation run time) beginning 15 May until final harvest in order to stimulate disease progress and development. Stand counts were conducted on a weekly basis beginning one week after transplanting on 19 April and 4, 11, 18, 25 and 30 May. Stand counts included number of live plants and number of plants infected with P. capsici each week. Two vigor ratings were taken on 26 April and 10 May where plants were rated on a scale of 1-10, with 10= live and healthy plants and 1= dead and dying plants. All squash fruits of a marketable size were hand harvested. Each harvest was separated into marketable and cull fruits, then counted and weighed. Additionally, cull fruits were separated and the number of fruit exhibiting signs of P. capsici lesions were counted per plot. Four total harvests were taken on 16, 22, 26 and 30 May. Treatments Non-treated control Bayer AE C40195 SL75 Rate n/a 1.64pt/A Cerexagri KFD-08-01 50%SP 1.75lb/A Cerexagri KFD-08-01 50%SP 3.5lb/A Ridomil Gold EC + Ridomil Gold Copper 65 WP 1pt/A 2.5lb/A Application Schedule No field treatment (5) drip applications every 7 days beginning at plant (6) drip applications every 7 days beginning at plant (6) drip applications every 7 days beginning at plant (1) drip application at plant Foliar spray application every 10-14 days as needed to manage disease rainfall in March, April, or May. To simulate an epidemic, we initiated a heavy irrigation schedule the last two weeks of the trial to ensure disease development. The heavy irrigation may have influenced the efficacy of the treatments since many of those treatments were applied when the disease was inactive early in the season. Results and Conclusions None of the treatments were significantly different from the non-treated control for any of the parameters measured at 5% significance level of Duncan’s Multiple Range test. However, all the treatments were numerically lower than the control for disease index, and percent disease. The year 2006 was a very dry year with very little 59 Table 1. 2006 Pcap Trial # 1 Application of Candidate fungicides, Bayer and Cerexagri for management of P. capsici Marketable Produce Cull Produce Total Yield Treatment Vigor2 Number3 Yield4 Number5 Yield6 Total Number 7 Total yield8 % Difference of Total Yield over Control9 1-Non treated control 8.4a 73.0a 35.1a 31.4ab 4.4a 102a 39.5a _____ 2-Bayer (AE C640195) SL75 1.64pt/A 8.5a 69.6a 32.9a 31.ab 101a 38.8a -1.77 5.9a 3-Cerexagri (KFD-08-01) 50%SP 1.75lb/A 8.5a 69.2a 36.5a 39.2a 4.9a 108a 41.5a +5.06 4-Cerexagri (KFD-08-01) 50%SP 3.5lb/A 8.0a 54.4a 28.9a 22.8b 4.7a 77a 33.6a -14.9 5- Ridomil Gold 1pt/A +Ridomil Gold Copper 65 WP 2.5lb/A 8.3a 67.8a 28.0a 31.b 5.0a 105a 33.0a -16.46 1 Data are means of five replications. Means in the same column followed by the same letter are not different (P=0.05) according to Duncan’s multiple range test. No letters indicate non-significant difference. 2 Vigor was done on a scale of 1-10 with 10= live and healthy plants and 1 = dead plants and an average was taken of vigor for 26 April and 10 May. 3 The fruit collected from each individual plot that was considered to be marketable and showed no symptoms of disease was separated and counted on 16, 22, 26, and 30 May. 4 The fruit was collected separately by each plot and the fruit considered marketable and non-diseased was weighed (in lbs.) on 16, 22, 26, and 30 May. 5 The fruit collected from each individual plot that was considered diseased and non-marketable was separated and counted on 16, 22, 26, and 30 May. 6 The fruit was collected separately by each plot and the fruit diseased and non-marketable was weighed (in lbs.) on 16, 22, 26, and 30 May. 7 Equals total number of fruits harvested both marketable and culls 8 Equals total yield (in lbs.) of fruits harvested both marketable and culls. 9 Equals Percent difference of Total yield over control was calculated by subtracting the total yield of each treatment from the control, then dividing that number by the control and multiplying by 100. 60 Table 2. 2006 Pcap Trial # 1 Application of Candidate fungicides, Bayer and Cerexagri for management of P. capsici Percent disease1 Disease Index2 Number infected fruit3 Percent difference of disease incidence from control4 83.1a 60.6a 11.4a _______________ 2-Bayer (AE C640195 SL75 1.64pt/A 69.5a 49.6a 16.4a -16.4 % 3-Cerexagri KFD-08-01 50%SP 1.75lb/A 66.5a 54.1a 17.8a -20.0 % 4-Cerexagri KFD-08-01 50%SP 3.5lb/A 72.2a 52.3a 12.0a 5- Ridomil Gold 1pt/A +Ridomil Gold Copper 65 WP 2.5lb/A 75.0a 59.4 15.2a Treatment 1-Non treated control 1 -13.1 % -9.7 % Percent Disease was calculated by dividing the total dead plants by the initial stand count and multiplying by 100. Culled squash fruits that exhibited visible signs of P.capsici were seperated and counted per plot .3 Percent Disease was calculated by dividing the total dead plants by the initial stand count and multiplying by 100. .4 Percent difference of disease incidence from control was control was calculated by subtracting the % disease from each treatment from the % disease of the control then dividing that number by the % disease of control and multiplying by 100. 2 61
