Off-line Sketch Interpretation
Matt Notowidigdo and Robert C. Miller
MIT Computer Science and Artificial Intelligence Laboratory
32 Vassar St.
Cambridge, Massachussetts 02139
noto@mit.edu, rcm@mit.edu
Abstract
We present a novel approach to creating structured diagrams (such as flow charts or object diagrams) by combining an off-line sketch recognition system with the
user interface of a traditional structured graphics editor. Our system, called UDSI (user-directed sketch interpretation), aims to provide drawing freedom by allowing the user to sketch entirely off-line using a pure
pen-and-paper interface. The results of the drawing can
then be presented to UDSI, which recognizes shapes,
lines, and text areas that the user can then polish as
desired. The system can infer multiple interpretations
for a given sketch to aid during the user’s polishing
stage. The UDSI program uses a novel recognition
architecture that combines low-level recognizers with
domain-specific heuristic filters and a greedy algorithm
that eliminates incompatible interpretations.
through a novel user interface that allows the user to select
alternative interpretations that the system has generated.
Introduction
UDSI (User-Directed Sketch Interpretation) is a new system
for creating structured, box-and-line diagrams that is based
on understanding hand-drawn sketches. Unlike other systems that require devices that can capture stroke information
while the user sketches the diagram, UDSI uses scanned images of sketches. The user presents a scanned sketch of the
diagram to UDSI and guides the application’s interpretation
of the sketch. The final result is a structured diagram that
can be incorporated into technical documents or refined in an
existing structured graphics editor. The user can iteratively
create the diagram using a pure pen-and-paper interface until the user is satisfied with the style, layout, and position of
the components of the diagram.
The UDSI system combines standard algorithms from the
machine vision literature for filtering, segmentation, and
shape detection (Jain, Kasturi, & Schunck 1995) with novel
algorithms for extracting text regions and recognizing arrowheads. These algorithms produce (possibly conflicting)
interpretations of the scanned sketch that are combined using an elimination algorithm to produce not only the best
candidate interpretation, but also multiple alternative interpretations. These alternatives are presented to the user
c 2004, American Association for Artificial IntelliCopyright gence (www.aaai.org). All rights reserved.
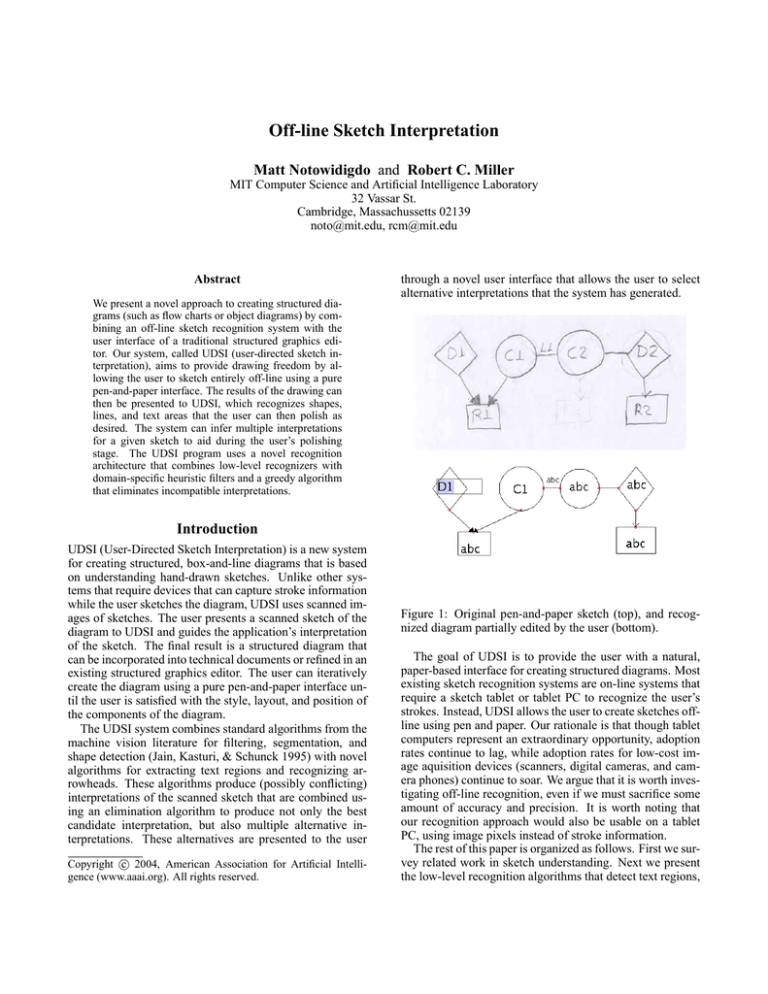
Figure 1: Original pen-and-paper sketch (top), and recognized diagram partially edited by the user (bottom).
The goal of UDSI is to provide the user with a natural,
paper-based interface for creating structured diagrams. Most
existing sketch recognition systems are on-line systems that
require a sketch tablet or tablet PC to recognize the user’s
strokes. Instead, UDSI allows the user to create sketches offline using pen and paper. Our rationale is that though tablet
computers represent an extraordinary opportunity, adoption
rates continue to lag, while adoption rates for low-cost image aquisition devices (scanners, digital cameras, and camera phones) continue to soar. We argue that it is worth investigating off-line recognition, even if we must sacrifice some
amount of accuracy and precision. It is worth noting that
our recognition approach would also be usable on a tablet
PC, using image pixels instead of stroke information.
The rest of this paper is organized as follows. First we survey related work in sketch understanding. Next we present
the low-level recognition algorithms that detect text regions,
rectangles, diamonds, circles, and arrows. We then describe
how the outputs of these low-level recognizers are combined to form a global interpretation of the sketch. Next, we
present the graphical user interface that allows the user to
edit the sketch and choose from alternative interpretations.
Finally, we describe a user study and report measurements
of recognition accuracy.
Related Work
This section briefly reviews related work in sketch understanding and sketch editing. Previous research in sketch understanding has generally chosen one of two paths: online
interfaces that require an instrumented drawing surface that
captures stroke information; or off-line interfaces that allow
the user to sketch using pen-and-paper. Most recent work
has chosen the online approach. Among the online systems, we will focus on systems for recognizing structured
box-and-line diagrams, since this is the domain targeted by
UDSI.
Lank et al (Lank, Thorley, & Chen 2000) used online
stroke information to recognize UML diagrams. UML symbols were recognized by heuristics such as stroke count and
the ratio of stroke length to bounding-box perimeter. Like
UDSI, the Lank system tries to distinguish between UML
symbols and character data. Its user interface allows the
user to correct the system at each stage of understanding:
acquisition, segmentation, and recognition.
Tahuti (Hammond & Davis 2002) is another online system for UML diagram recognition, which uses both geometric and contextual constraints to recognize UML symbols.
Tahuti is non-modal: users can interleave editing and drawing with no mode switching, which requires editing gestures
to be distinguishable from sketched symbols.
Denim (Lin et al. 2000) is an online system for informal
sketching of web site designs, in which the user can sketch
boxes to represent web pages and lines to indicate links between the pages. Different kinds of links are recognized
based on their context, rather than on their shape. Denim
uses a unistroke recognizer (Rubine 1991), so each symbol
must be sketched with a single stroke.
Sezgin et al (Sezgin & Davis 2001) have created an online
system that recognizes geometric primitives. The system
uses a three-phase technique (approximation, beautification,
basic recognition) to transform sketches into sharpened diagrams. Its recognition process uses shape and curvature of
strokes, among other information.
One of the earliest tools in this category was SILK (Landay & Myers 1995), which recognized sketches of user interfaces. The sketch could then be converted into an interactive
demo of the sketched GUI.
Jorge and Fonseca presented a novel approach to recognizing geometric shapes interactively (Jorge & Fonseca
1999), using fuzzy logic and decision trees to recognize
multi-stroke sketches of geometric shapes.
Research on off-line sketch interpretation, using scanned
images of pen-and-paper diagrams, is less common. Valveny and Marti discuss a method for recognizing handdrawn architectural symbols (Valveny & Marti 1999) using
deformable template matching. They achieve recognition
rates around 85%, but do not discuss how the user might correct an incorrect recognition. Ramel (Ramel 1999) presents
a technique for recognizing handwritten chemical formulas,
with a text localization module that extracts text zones for
an external OCR system. They also use a global perception
phase that incrementally extracts graphical entities. Their
system achieves recognition rates of 95-97%, but as in Valveny and Marti, there is no discussion of how the user can
correct recognition errors.
Perceptual editing, exemplified by ScanScribe (Saund &
Moran 1994), is a collection of user interface techniques for
manipulating scanned sketches as if they were structured diagrams. These tools attempt to fill the current void in computer editing tools that provide support for perceptual editing of image bitmaps. UDSI is similar to this line of work
in that the input documents are informal, rough sketches,
but UDSI provides an interface for the user to transform the
rough sketch into a beautified structured diagram.
Shape Recognition
UDSI’s recognition module takes an image bitmap and converts it to a set of geometric primitives that are presented
to the user in the GUI. Our system recognizes text regions,
rectangles, diamonds, circles, and arrowheads.
Sketch recognition proceeds sequentially through several
steps: image smoothing, segmentation, text/shape recognition, and generation of alternatives. At the end of this process, the system contains an initial interpretation and a set of
alternative interpretations. The initial interpretation is then
automatically aligned using relationships inferred from the
diagram.
Smoothing and Segmentation
Image acquisition devices introduce some noise into the
sampled image bitmap of the original sketch. Because of
this, UDSI uses an image filter to preprocess the image
bitmap before passing it to the core of the segmentation process. We use a discrete gaussian filter to smooth out the
noise because it is rotationally symmetric and therefore will
not bias subsequent line pixel detection in any particular direction (Jain, Kasturi, & Schunck 1995). We empirically
determined the optimal filter size based on the sample of images collected from a pilot user study. This optimal filter size
is dependent on the size of the image, and also the resolution
at which the image was scanned. For all of the experiments,
the sketches were drawn on 8.5x11 paper, scanned at 100
dpi, and thresholded to black-and-white. For these parameters, we found that the optimal filter size is 3x3 pixels. The
reason the optimal filter size is small is because the scanned
images are already highly thresholded; therefore, not much
smoothing is needed for accurate line detection. The tradeoff when choosing filter size is that the larger filter smoothes
out more of the noise, but at the expense of image details
that would improve the precision of the recognizers.
The output of the filter is a smoothed image bitmap that
is presented to the segmentation step, which first computes
the line pixels of the image. Segmentation is accomplished
through the following steps: Canny line detection, contour
following, line splitting, and segment merging. Standard algorithms were used for these steps (Jain, Kasturi, & Schunck
1995). The output of the segmentation step is a set of line
segments that are used by the individual recognizers.
Text Recognition
UDSI does not implement character recognition, but it does
locate text regions that it presents to the user as editable text
fields. Dense regions of short line segments are assumed
to be text regions. These regions are found using a simple
merging algorithm. For each small line segment, the system
scans for other small segments that are within a small neighborhood of the given segment. If the two segments are close
enough, then the system merges the two segments into a single text region. This algorithm continues until the system
can no longer merge any recognized text regions. Finally,
the algorithm drops text regions containing fewer segments
than a fixed threshold. This threshold was determined empirically to be at least three segments per text region, but this
value seems to be very sensitive to the text size and the resolution of the input image. An example of text recognition
is shown in Figure 2.
Figure 2: Text recognition. Original image shown with recognized text rectangles drawn in. Most of the false positives
(arrowheads, circle arcs) are filtered out later by global interpretation.
Corner Detection
Right-angle corners are detected in order to find rectangles
and diamonds. Corner detection is accomplished by searching for pairs of segments that approximately meet and testing that the angle between them is approximately 90 degrees. Corners are then classified as axis-aligned or nonaxis-aligned; axis-aligned corners are used by the rectangle
recognizer, and non-axis-aligned corners are used by the diamond recognizer. A double threshold is used so that a corner
can be classified as both types if it is in between the threshold values (Figure 3).
Rectangle Recognition
Rectangles are detected using the following algorithm: if a
corner is (approximately) horizontally aligned and (approximately) vertically aligned with two other corners, then a
Figure 3: Results of corner detection. Corners that will only
be used by one of the recognizers (either diamond or rectangle) are shown as unfilled circles; corners that will be used
by both recognizers are shown as filled circles.
rectangle exists that spans the area of the three corners. This
algorithm can generate false positives since it only requires
three corners to produce a rectangle interpretation, but it
generally produces all true positives. False positives are filtered out by the heuristics and greedy elimination algorithm
described below. Our approach to shape recognition, in general, follows the same pattern: try to generate all true positives, even if it involves generating a fair number of false
positives, as well. There are two reasons for doing this: (1)
if the true positive is missed, then there is no way subsequent steps can ever achieve complete recognition, and (2)
users can more easily delete a false positive than create a
(missed) true positive.
In order to improve the accuracy of the rectangle recognizer, two modifications to the simple algorithm described
above were made. The first is described in Figure 4. This
figure shows two sets of corners. The unfilled corners are
aligned appropriately, but a rectangle is not recognized because one of the corners points outwards. The set of filled
corners, on the other hand, represent an initial rectangle
recognition. This rectangle, however, will not make it into
the global interpretation because it will be filtered during the
greedy elimination algorithm (described below).
Diamond Recognition
Diamond recognition is analogous to rectangle recognition:
if a corner is (approximately) aligned with another corner
along the y=x axis and is also (approximately) aligned with a
corner along the y=-x axis, then a diamond exists that spans
the area of the three corners. As with the rectangle recog-
Figure 4: Rectangle recognition. The unfilled corners constitute a rectangle that is not recognized because one of the
corners is facing outwards. The filled corners constitute a
rectangle that is recognized (albeit incorrectly).
nizer, the diamond recognizer generates some false positives
(though less frequently than the rectangle recognizer), but it
generally generates all true positives. Choosing among the
false and true positives is deferred until the filtering stage.
Circle Recognition
Circle recognition is done by a modified Hough transform
algorithm (Ballard 1981). The conventional Hough transform for circle detection uses a voting technique. Each edge
pixel in the image contributes a vote that it belongs to a circle whose center lies on a line passing through the point and
perpendicular to the edge (as determined by the gradient angle at that point). When a center point and radius receives
enough votes from edge points, it is recognized as a circle.
Our modified algorithm uses segments instead of edge
pixels. The accounting step continues to find center points
and radius values, but instead of using all edge points and
gradient angles, the algorithm uses only each segment’s perpendicular bisector. To visualize what the algorithm is doing, imagine segmenting a circle, and then extending lines
along each segment’s perpendicular bisector (Figure 5). Areas of close intersection correspond to approximate circle
center points, and the average distance from the center point
to each of the segments is the approximate radius of the circle.
This algorithm has two advantages over the conventional
pixel-based Hough transform. First, it is faster, because
there are far fewer segments than pixels to process; and second, it tends to produce fewer false positives in practice.
Arrow Recognition
Arrow recognition is implemented using a modified version of the algorithm described by Hammond (Hammond
& Davis 2002). For simplicity, UDSI’s algorithm currently
recognizes line arrowheads and filled triangle arrowheads,
but not open triangle arrowheads.
Figure 5: Circle detection using a modified Hough transform, which recognizes circles by using perpendicular bisectors of constituent segments.
Performance
The algorithms described above are polynomial search algorithms where the search space is the set of segments generated from the segmentation step. These search algorithms
are not particularly fast, but we have found the inefficiency
to be negligible in practice since these algorithms search in
segment space instead of pixel space. In practice, the time
spent in the Gaussian filter and segmentation phases (which
are algorithms that scale linearly with the number of pixels
in the image) is approximately equal to the time spent in the
remainder of the recognition module (where the algorithms
scale quadratically or cubically with the number of features).
Global Interpretation
After the recognition phase, the system has generated a set of
recognized shapes, segments, arrowheads, and text regions
from the original image. The final step is to filter the set of
recognized objects to create an initial interpretation and a set
of alternative interpretations. Because all of the recognizers
have a low false negative rate (meaning that they rarely miss
true positives), this step can be implemented purely as a filtering process. There are two types of filtering that occur:
(1) heuristic filtering that uses domain-specific information
to eliminate global interpretations that do not satisfy domain
constraints, and (2) greedy elimination to choose the best
interpretation among competing local interpretations. These
two types of filtering are discussed in greater detail below.
Heuristic Filters
Recognition rates improve with the use of heuristic filters —
domain-specific filters that use domain-specific constraints
to discard non-conforming interpretations. For example, the
domain of box-and-line diagrams does not use overlapping
shapes; therefore, if the shape recognizers independently
recognize the same area to contain two different shapes, then
a heuristic filter (representing the heuristic “shape areas cannot overlap”) can choose the shape with higher confidence
and relegate the other shape to an alternate interpretation.
We have found three heuristics to be useful in increasing the
recognition rates.
The first heuristic filter implements the “shape areas cannot overlap” heuristic. Figure 6 graphically describes how
this filter behaves. Shapes that overlap are not allowed in the
domain; therefore, if shape areas overlap the system chooses
the shape with a higher confidence value.
Figure 6: The “shape areas cannot overlap” heuristic filter.
Here the circles are recognized with lower confidence values
than the rectangle and diamond; therefore, they will not be
included in the initial interpretation.
The second heuristic filter implements the “line segments
cannot intersect shape areas” heuristic. This is similar to
the previous filter, except that instead of comparing shape
confidence value, it just looks for recognized line segments
within recognized shape boundaries. In Figure 7, the light
segments represent segments that will be thrown out by this
heuristic filter. The dark segments will be thrown out during
greedy elimination because they are part of the corners that
make up the recognized diamond.
Figure 8: The “line segments cannot intersect text rectangles” heuristic filter.
Greedy Elimination Algorithm
The final stage of the sketch recognition module selects the
best global interpretation and generates alternative interpretations. Each of the shape recognizers described above proceeds independently, and assigns a confidence value when
it recognizes a shape, as well as marking each recognized
shape with the constituent segments that were used to form
the hypothesis. A straightforward greedy elimination algorithm is used that first sorts all interpreted shapes by confidence value, and proceeds down this list one shape at a time
to build up a global interpretation. When we encounter a
shape that shares any line segments with a higher-confidence
shape that has already been selected, the new shape is eliminated from the initial interpretation, and instead recorded as
an alternate interpretation of the higher-confidence shape.
This algorithm can be modified along several interesting
dimensions. Instead of greedily eliminating a shape that
shares any segments with a previously chosen shape, the algorithm can eliminate a shape only if all of its segments are
shared with previously recognized shapes. For example, this
would allow an interpretation in which two adjacent rectangles share an edge. This analysis is left for future work.
The greedy elimination algorithm provides an effective
filter among the false and true positives because, in principle, the true positives should be recognized with higher
confidence levels. They are therefore selected first, and the
false positives are eliminated because their segments overlap
with previously chosen shapes.
Alignment Module
Figure 7: The “line segments cannot intersect shape areas”
heuristic filter.
The final heuristic filter implements the “line segments
cannot intersect text rectangles” heuristic. This heuristic ensures that mid-length segments in handwritten text that may
be missed by the text recognizer (such as the descender of
the letter y in Figure 8), are not included in the final interpretation. In pilot tests, users reported that they had trouble
seeing these extra segments and that they were frustrated that
they had to delete them.
Once the global interpretation has been generated, the application attempts to sensibly align the components. The purpose of this alignment module is to make lines and shapes
that the user has approximately aligned in her original sketch
exactly align in the initial interpretation. We developed
heuristics for when lines close to shapes actually represent
connection points, and also found thresholds for when to decide to make lines vertical/horizontal. Because it is important to maintain connection point relationships while aligning lines and shapes, the alignment module must efficiently
solve systems of linear constraints, which it does using the
simplex solver in Cassowary (Badros, Borning, & Stuckey
2001).
User Interface
The UDSI graphical user interface combines many features
from standard graphics editors (move-to-back/front, dragselect, multiple-selection, connection points) with a mediation interface to select from alternative interpretations. The
result is a GUI that looks and feels like a standard graphics
editor that has been slightly instrumented to take advantage
of recognition information to help guide the user’s editing
process. The user interface was implemented entirely using
Java Swing.
Since UDSI currently lacks handwriting recognition, one
important task for the user is editing the text labels from
the default (“abc”) to the desired text. The user interface
optimizes for this task by allowing a single click on a text
label to put it into editing mode.
Another major task of the user interface is correcting
recognition errors. UDSI offers a mediation interface that
presents alternate interpretations of parts of the sketch. This
interface is displayed whenever the user selects a shape that
might have alternate interpretations (Figure 9). This is a
choice-based mediator (Mankoff, Hudson, & Abowd 2000).
The other typical strategy for error correction is repetition,
which is done in UDSI by deleting the incorrect interpretation and creating the correct shapes using graphical editing
tools. Although choosing an alternative interpretation can
save time over deleting and recreating shapes, user studies
revealed that users rarely used the choice-based mediator,
preferring to delete and recreate instead.
User Study
A user study was conducted to compare UDSI with a conventional structured graphics editor, Microsoft PowerPoint.
The study involved 21 participants, ranging from 19 to 33
years old, evenly divided between men and women. Twothirds of participants described themselves as experienced
with PowerPoint; the rest had little or no PowerPoint experience. No tutorials were given for either UDSI or PowerPoint.
Each user was asked to produce one finished diagram with
UDSI (drawing it on paper, scanning it, and then correcting
the recognition) and one diagram with PowerPoint. The desired diagram was described by a simple formal language
consisting of statements like “Circle C1, Rectangle R1, C1
points to R1”, so that their sketches would not be biased by
copying a diagram. Users were given a warmup task prior to
the experiment to familiarize them with the formal language.
Both tasks produced similar diagrams, using the same number of each kind symbol (circles, diamonds, rectangles, filled
arrows, plain arrows, and labeled lines), with a total of 11
symbols and 7 text labels in each diagram. The orders of
the diagrams and interfaces were randomized to eliminate
learning effects.
The user study found that UDSI was slightly slower on average than PowerPoint (6 min 8 sec to create a diagram with
UDSI vs. 5 min 23 sec for PowerPoint). However, when the
finished diagrams were evaluated by a panel of judges (recruited in the same way as users, and not told how each diagram was produced), the UDSI diagrams were rated significantly higher in alignment and overall quality (Notowidigdo
2004). We discuss some possible reasons for this difference
below.
Recognition Accuracy
Figure 9: User selection of ambiguous shape triggering display of alternate interpretations.
Recognition accuracy was evaluated using a set of 25
sketches collected from users (the 21 users in the user study
plus 4 pilot users). Each sketch image was passed through
low-level recognition and global interpretation to produce a
final structured diagram. The false positive rate fp is calculated by dividing the number of incorrectly recognized
shapes (shapes that appear in the recognized diagram but
not in the original sketch) by the number of shapes in the
original sketch. The false negative rate fn is calculated by
dividing the number of shapes that failed to be recognized by
the number of shapes in the original sketch. Table 1 reports
the aggregate false positive and false negative rates for various recognizers (shapes, lines, and text regions). For several
images, the false negative rates are zero, which means that
all shapes in the original sketch also appeared in the recognized diagram.
Discussion
Evaluation
UDSI was evaluated by a user study and by measuring its
recognition accuracy on users’ sketches. This section briefly
describes these evaluations. More detail can be found elsewhere (Notowidigdo 2004).
As these results show, recognition in UDSI is biased strongly
toward false positives. Both kinds of errors (false positives
and false negatives) require effort from the user to correct
the error. To correct a false positive, the user must delete the
shape from the diagram. For a false negative, the user must
create the shape from scratch. The total amount of effort that
shapes
lines
text regions
overall
fp
10.2%
25.4%
70.7%
35.8%
fn
7.3%
3.2%
2.1%
4.3%
Table 1: Average recognition accuracy. fp measures false
positives (elements incorrectly generated by recognition, as
a fraction of original sketch elements), and fn measures
false negatives (elements missed by recognition, as a fraction of original sketch elements).
the user must exert to correct the recognized diagram is thus
a weighted sum of the false positive correction rate and false
negative correction rate. Future work can attempt to actually
estimate the weights, but from observations made during our
user study, we believe that false positives are easier to correct than false negatives.
Text recognition, in particular, produces many false positives. For every text region correctly recognized, there are
.707 text regions that are also falsely recognized. This suggests that better recognition and better filtering are needed
to improve the performance of the text recognition module. One possible improvement would be to include more
domain-specific heuristics; another might be to incorporate
handwriting recognition, which would help filter out unrecognizable text regions.
The user study showed that UDSI produced higherquality diagrams than PowerPoint, at the cost of slightly
more time. This difference is partly due to UDSI’s alignment
module, which automatically improves the alignment of the
diagram. Another reason for the difference, deduced by observing users in the study, is that the UDSI approach encourages more careful planning and whole-diagram iteration.
Several users drew more than one pen-and-paper sketch with
UDSI, delaying scanning and recognition until they were
satisfied with the overall layout. In contrast, PowerPoint
users never iterated their diagrams from scratch, and some
users found rearranging a bad layout so time-consuming in
PowerPoint that they appeared to just give up.
Conclusion
We presented a novel approach to creating structured diagrams by combining an off-line sketch recognition system
with the user interface of a traditional structured graphics editor. The current system recognizes geometric shapes, lines,
text regions, and arrowheads, and it provides a user interface
to modify interpretations and edit components.
For future work, UDSI’s vision-based approach of recognition should be evaluated in an on-line system on an instrumented tablet computer. This will allow UDSI to provide
some real-time feedback if users begin to draw shapes that
the system will be unable to recognize at all, which is a risk
of the purely off-line approach.
References
Badros, G.; Borning, A.; and Stuckey, P. 2001. The
Cassowary linear arithmetic constraint solving algorithm.
ACM Transactions on Computer Human Interaction.
Ballard, D. 1981. Generalizing the Hough transform to detect arbitrary shapes. Pattern Recognition 13(2):111–122.
Hammond, T., and Davis, R. 2002. Tahuti: A geometrical sketch recognition system for UML class diagrams. In
Proceedings of AAAI Spring Symposium on Sketch Understanding, 59–68.
Jain, R.; Kasturi, R.; and Schunck, B. G. 1995. Machine
Vision. McGraw-Hill.
Jorge, J. A., and Fonseca, M. J. 1999. A simple approach
to recognize geometric shapes. GREC, LNCS 1941.
Landay, J. A., and Myers, B. A. 1995. Interactive sketching
for the early stages of user interface design. In Proceedings
of CHI ’95, 43–50.
Lank, E.; Thorley, J. S.; and Chen, S. J.-S. 2000. Interactive system for recognizing hand drawn UML diagrams. In
Proceedings of CASCON 2000.
Lin, J.; Newman, M. W.; Hong, J. I.; and Landay, J. A.
2000. Denim: finding a tighter fit between tools and practice for web site design. In Proceedings of CHI ’00, 510–
517.
Mankoff, J.; Hudson, S. E.; and Abowd, G. D. 2000. Interaction techniques for ambiguity resolution in recognitionbased interfaces. In Proceedings of UIST ’00, 11–20.
Notowidigdo, M. 2004. User-directed sketch interpretation. Master’s thesis, Massachusetts Institute of Technology.
Ramel, J.-Y. 1999. A structural representation adapted to
handwritten symbol recognition. GREC, LNCS 1941.
Rubine, D. 1991. Specifying gestures by example. In
Proceedings of SIGGRAPH ’91, 329–337.
Saund, E., and Moran, T. 1994. A perceptually supported
sketch editor. In Proceedings of UIST ’94.
Sezgin, T. M., and Davis, R. 2001. Early processing
in sketch understanding. Proceedings of 2001 Perceptive
User Interfaces Workshop.
Valveny, E., and Marti, E. 1999. Deformable template
matching within a bayesian framework for hand-written
graphic symbol recognition. GREC, LNCS 1941.


