From: AAAI Technical Report SS-92-02. Compilation copyright © 1992, AAAI (www.aaai.org). All rights reserved.
Control of Automated Empirical
Diagrammatic
Representation
Discovery
by
of Theory*
Jan M. 7,ytkow and Jieming Zhu
Department of ComputerScience
Wichita State University, Wichita, KS67208
Abstract
An empirical regularity is typically limited to a particular range of independent variables. If manysuch
regularities hold in a multi-dimensional space of independent variables, a diagrammatic representation of
the set of regularities and their boundaries can help
us to understand their distribution, and the completeness of the set of regularities. Furthermore, a diagrammatic representation can guide the search for regularities. Machine discovery systems, such as BACON
and
FAHRENHEIT,combine automated experimentation
and theory construction based on inductive generalization of data. Wedescribe the incremental manner in
which FAHRENHEIT
builds a diagram of regularities
and uses the diagram to set forward further experiments and theoretical goals until a complete theory is
found. Because the diagram of regularities and their
boundaries reflects the topology of the space under investigation, it is instrumental in search control and in
significant reduction of the search size.
Introduction
The search for regularities in a multi-dimensional space
of empirical parameters was studied a decade ago in
the BACON
project (Langley, Simon, Bradshaw, and
Zytkow 1987). While remarkably successful at rediscovering many laws of physics and chemistry, BACONis limited to situations in which a single regularity holds for all datapoints. If manypartial regularities
are present, the FAHRENHEIT
discovery system can
discover them gradually, continuing the search until it
reaches an empirically complete theory.
Several other systems, including ABACUS
(Falkenhainer & Michalski 1986), IDS (Nordhausen & Langley
1990), and KEPLER(Wu & Wang 1989) made various
improvements over BACON,but they do not conduct
autonomous exploration and must be fed data. Unlike
FAHRENHEIT,
they do not search for new unexplored
"The work described in this paper was supported by
Office of Naval Research under the grants No. N00014-88K-0226and N00014-90-J-1603.
173
areas of empirical variables and cannot claim the completeness of their theory.
Weconcentrate on the representation of the regularities incrementally discovered by FAHRENHEIT.
It
is organized as a graph, which models the topology of
laws and their boundaries in the parameter space. We
will discuss FAHRENHEIT
at the level of main subgoals, demonstrating how the graph allows FAHRENHEITto select further discovery goals, and how theoretical analysis is intermingled with the acquisition of
new data points. Both activities feedback into each
other, and new results are automatically integrated
into the graph.
We concentrate on numerical parameters. Automated empirical exploration of a multi-dimensional
space of numerical parameters in search for regularities
is an important task--common to science, engineering and other domains. The applications of FAHRENHEIT include automated experimentation and discovery in a chemistry laboratory (7,ytkow, Zhu & Hussam
1990), learning manipulation skills by an autonomous
robot (Zytkow & Pachowicz 1989) and many others.
The task of empirical discovery
numerical space
in a
Consider N independent variables x1, ...,z # and one
dependent variable y (also named z°). Each variable
zi., i = 0, 1, ..., N is limited in scopeto a set of values
V’, i = 0, 1, ..., N. Each Vi is a segment of real numbers. A resolution relation holds in each Vi: the pairs
of values are not distinguishable if they differ by less
than ¢i. The tuples of values of all variables form a
cartesian product E = V° x ... x N.
V
Experiments are the only way for obtaining information about E. Each experiment consists of selecting a
set of values for zi, i = 1, ..., N, and in collecting the
value of y. The meaningful differences in values of
zi, i -- 1, ..., N are not smaller than the resolution ~i.
The task of an autonomousempirical discoverer is to
generate as complete and empirically adequate theory
of E as possible, including regularities for the dependent variable and boundaryconditions for regularities.
Incremental construction of the graph
of knowledge
Linking regularities by identification and
continuity
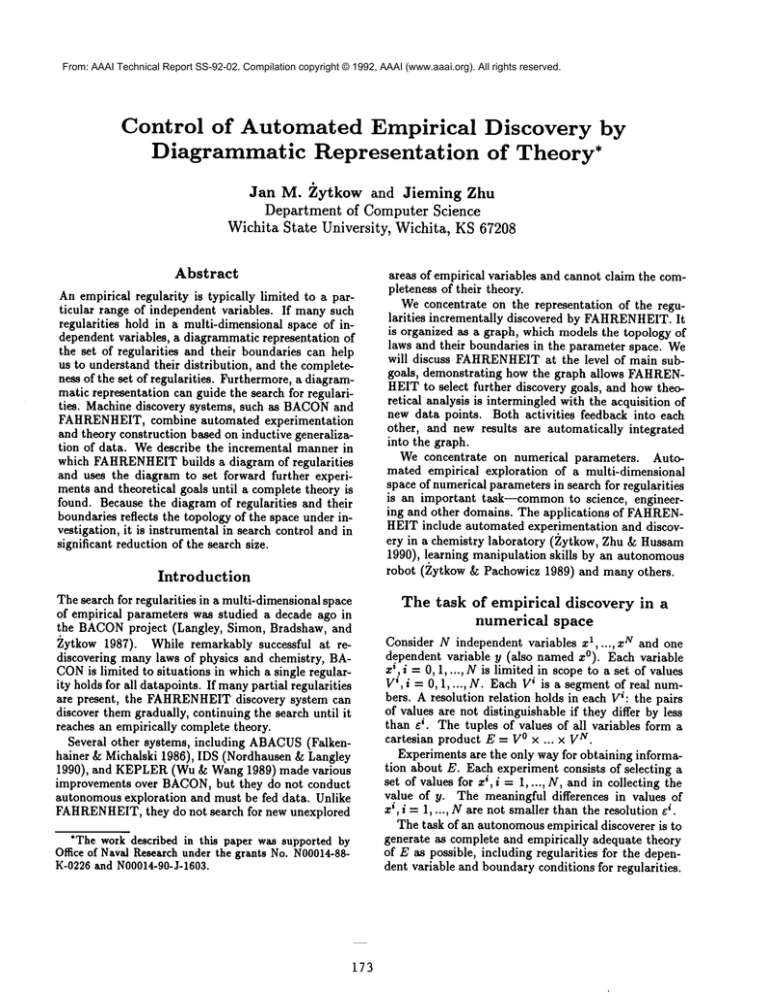
In our walk-through example we consider a space of
two independent variables z1 and z 2, with regularities
Rt, R2, and R3 divided by boundaries B1, B2, and B3,
as depicted in Figure 1. Discovery of a complete theory
consists of many simple steps performed repeatedly.
They fall into few categories described in this paper.
,2
/
..........
,, .Bf
/
t ,quUu.tt,,,.../l~
).* a~..u~ity/
R3
L
Figure 1. FAHRENHEIT
can discover multiple regularities and
boundariesbetweenthemin a multi-dimensional
data space. The
situation depictedin this figure is consideredas a walk-through
example.
Regularity
in one independent
variable
FAHRENHEIT
starts from the search for a regularity in one independent dimension (say zl, while 2 i s
kept constant). After the system finds an equation,
it determines the upper and lower boundaries within
which the equation holds (Zytkow 1987). The results
are depicted in Figure 2. Data not fitting the regularity
becomethe seeds from which the search for regularities
can continue (seeds2 and seeds3 in Figure 2).
/x
Step after step, a number of one dimensional regularities for ~1 are discovered, each for another constant
value of z 2, and the boundaries of those regularities,
as depicted in Figure 3. Before the results can be generalized to z2, the corresponding regularities and their
boundaries must be linked together. This process can
be best illustrated on identification of maxima, shown
in Figures 4a and 4b.
Maxima can be viewed as a specific pattern in
data, analogous to regularities and their boundaries.
Each pattern summarizes a certain portion of data by
recording values of specific parameters, and their errors. The same discovery mechanisms apply to parameters in all patterns. Suppose that FAHRENHEIT
discovers two maximarnll and m12for the value z~ of
x2, as illustrated in Figure 4a, and one maximumm~l
for the value z~ of z~, also in Figure 4a. Maximarnll
and m21can be linked together, because their properties are muchcloser than for the pair rn12, m~l. Their
locations 1il, heights hil, and widths wil (i = 1, 2) are
similar and different from ml~. Not always, however,
does the similarity criterion produce a strong preference. If the linkage is ambiguous, FAHRENHEIT
applies a mechanismbased on continuity. It selects another value of z32, z~, between x~ and x~, finds maxima
for that value, and tries to link them both to maxima
for z~ and x~. The closer the values of z 2 are, the
smaller the differences are between the corresponding
patterns in data. In Figure 4b, mHand m21are linked
via m31, which is similar to both, even if rn12 is also
similar to m~l because they have the same location.
The same linkage mechanismapplies to regularities
and their boundaries. A false linkage slows the progress
of FAHRENHEIT,which must eventually
backtrack
and try other options, but this task goes beyond the
scope of the present paper.
Figure2. In a onedimensional
sequenceof data (xI 2is varied, x
is constant), FAHRENHEIT
discoversa regularity, the lower(lb)
and upper(ub)boundary
for the regularity, andtwocollections
(seeds2 andseeds3)of data whichdonotfit the regularity, but
fromwhichthe further searchfor a newregularitycanstart.
Figure3. Exploringdifferent values of x2, FAHRENHEIT
discovers a sequenceof one-dimensional
regularities and their bound2.
aries, andthen generalizesthemto the seconddimensionx
Equation finder
Equations in one independent variable are discovered
by an empirical equation finder. The task can be formally defined by the input in the form of a set of n
datapoints (~:i, Yi, ~i), i = 1, ..., n. Theoutput is (1)
equation which satisfies the input data within error, (2)
the values of the parameters in the equation and (3)
errors of the parameters (Zembowicz & Zytkow 1991).
Recursive generalization of empirical
regularities
Following BACON,FAHRENHEITgeneralizes
regularities repeatedly to other independent variables. The
equation finder is applied recursively, one at a time, to
174
all newly introduced dependent variables, that is to all
parameters in each detected regularity, and to up*per
. and lower boundaries for each regularity.,
h:l
<"-°"".,,,_..__
I/ii:’ #"
AA.#"
"~ ~,,,
,~
/: ~hll
]] :el21mll.’/
/ ¯ / m12
/-t
m. ’3
2/ / Aii!.... -~.:$.jr/~..~;
i " ; :" " .....
/ml,
m,2
m’3
upper boundary of regularity R2 is equal to the lower
boundary of RI. (This could have been discovered earlier, at the time when the theory for one independent
variable x1 was discovered, but can be also done later,
een.,n.o.,heo.derinwh,<
,<,
,,e
boin,
m,de.
<ommo,i.
resented by a commonnode lb(R,)&ub(R2) in Figure
6b, and as nodeB1in Figure6c._
x27
.
.. BI..
::
’ .......’ .....................
_ .......
....
...-’" ’~....
0 .... . ........~ .......
, .......
|l:: ......
~,,,"li" ,,:"ii"~"Nii""’,,,..$
..... ,,.,,,""’"’~’"’-’:iIil,,
#~"
~ .........
Figure 4. FAHRENHEIT
can identify discoveredobjects (here,
maxima)
basedon (a) identity and(b) continuity.
The equation finder is applied when enough data
have been collected in the form of regularity parameter values and boundary values, as illustrated in Figure 3. For each dependent variable introduced at the
level of x1, it may discover an equation, or a number
of equations divided by their boundaries. After the
equations are discovered, the experimentation continues, until the boundary in x2 for each new regularity
has been discovered. This process typically generates a
large number of new parameters, as depicted in Figure
_..2......
2....2.
2.......
....
...... ,,’"-:..:::.,,
;:, ........
~,
, ,~....--"#...
................
(b’~
i-~
.
...-’~
"..
2i
.."
~ewedge,lowerlimit onRl(Xl,x~)
(c)
~
xl
x2
Ib pj P4 ub Ib pS P6 ub llb P7 P8 ub lib P9 PlO ub
Figure5. Exponentialcomplexityof the knowledge
tree in
BACON
and FAHRENHEIT.
(BACON
in thicker fines). Pl, P2,
....Pnare parameters
in the regularities, suchas slopeandintercept
in a linear equation.
Figure 6. WhenFAHRENHEIT
generalizes the regularities and
boundariesto x2, a tree of newregularities andboundariesis cre’ated, shown
in (a). Many
nodesat the 2 level are identified, creatingintermediategraphsas in (b) andfinally the graphin (c).
asterisks (*) indicatethe appropriateregularities.
The number of new parameters grows exponentially.
This is the case in BACON,whose new terms are
markedwith thick lines in Figure 5, and is aggravated
to a larger exponent base in FAHRENHEIT.
Although
the tree-like structure of knowledgefits the recursive
mechanismof generalization, it does not correspond to
the topology of regularities and their boundaries in the
space E, illustrated in Figure 1.
Representation
of knowledge by a graph
Initially, the generalization produces the tree-like next
level of new parameters, as depicted in Figure 5. We
will consider in detail the examplein Figure 6a, corresponding to the discoveries madefrom data in Figure 3.
Manynodes in the tree in Figure 6a correspond to the
same objects in the numerical space. For instance, the
175
Another group of nodes that are identified is the
upper boundary of the regularity on upper boundary
of R2, the upper boundary of the regularity on lower
boundary of R1, and the upper boundary of the regularity on upper boundary of R1, all of them corresponding to the same point/3 in Figure 6c.
Still another pair of nodes that is identified is the
lower boundary of the regularity on upper boundary
of R~, and the lower boundary of the regularity on
upper boundary of R1. They both form the joint point
a in Figure 6c.
Newboundary nodes can be also created by comparison of nodes. Two nodes have the same value of
x2, although they are not identical, because they have
distinctly different values of x1. They are the lower
boundary of the regularity on the lower boundary of
R1, and the lower boundary of the regularity on the
upper boundary of R1. They are marked respectively
as a and ~ in Figure 6c. Because a and ~ have different values of x1, and they are boundary points for the
same regularity R1, a new boundary is created, as illustrated in Figure 6b. Incidentally, this new boundary
coincides with the space boundary.
Using the knowledge graph to create
new discovery tasks
Suppose that FAHRENHEIT
has found an equation F,
including M independent variables, M < N, and that
it has determined the scope S of application of F. As
a result it produced a graph G of the order M, such as
in Figure 6e. G represents regularities and boundaries
discovered for Mindependent variables. At that point
FAHRENHEIT
can apply two operators:
1. Generalize the regularity R = S ---* F to another dimension (cf.. the ordering search in the space
of generalizations,
Zytkow 1987). The instances of
the generalization operator correspond to the remaining independent variables z M+l,...,zN. Generalization may be called "vertical" expansion. Notice that
at the very beginning a special case of generalization
applies: zk = z1 and R = nil.
Generalization is guided by G, which organizes exk.
perimentation in various slices of the new variable z
If G cannot be reproduced in one of the slices, it
means that the sought for (M + 1)dimensional regularity no longer intersects that slice. The continuity-based
mechanismdescribed earlier picks up an intermediate
value of zk, until such a value is found at which the
topology of G changes.
2. Another operator, find-a-new-area looks for a
"horizontal" expansion of graph G. It looks for a new,
non-investigated area in the M-dimensional subspace
of independent variables. Goodindicators of such new
areas are "seeds" which are attached to various boundaries in the form of collections of M-tuples of independent values for which no regularity has yet been found.
Each set of seeds can be used to start the new experiments in search of a new regular!ty, starting from one
of the independentvariables in zs, i = 1, ..., Mand the
dependent variable y. For instance, if R1 and R2 have
been discovered, as described in Figure 6c, then the
search for a new area returns one or few points in the
area of R3, from which R3 can be gradually discovered.
The exploration of E continues until all areas are
covered by regularities. At that point the task of finding an empirically complete theory is finished. This
corresponds to the state of knowledgedepicted by the
graph in Figure 7 for our walk-through example.
Conclusions
Wedemonstrated that a diagrammatic representation
of the knowledge discovered during empirical explo-
176
ration of an N-dimensional space E is useful in several
ways. It helps us to understand knowledge, because the
diagram corresponds topologically to the distribution
of regularities in E. The diagramis particularly helpful
when the number of dimensions is bigger than 2. Diagrammatic representation reduces knowledge representation complexity from exponential to proportional to
the number of regularities
and their commonboundaries. The discovery process is far more efficient because redundant discovery steps are not performed.
Figure7. Thefinal state of knowledge
for the walk-through
example.
Acknowledgment:
help of Lance Petrie.
Weacknowledge the editorial
References
Falkenhainer, B.C., & Michalski, R.S. (1986). Integrating Quantitative and Qualitative Discovery: The
ABACUS
System, Machine Learning, 1, 367-401.
Langley, P.W., Simon, H.A., Bradshaw, G., & Zytkow
J.M. (1987). Scientific Discovery; An Account of the
Creative Processes. Boston, MA:MITPress.
Nordhausen, B., & Langley, P. (1990). An Integrated
Approach to Empirical Discovery. m: J.Shrager &
P. Langley (eds.) Computational Models of Scientific
Discovery and Theory Formation, Morgan Kaufmann
Publishers, San Mateo, CA, 97-128.
Wu, Y. and Wang, S. (1989). Discovering Knowledge
from Observational Data, In: Piatetsky-Shapiro,
G.
(ed.) Knowledge Discovery in Databases, IJCAI-89
Workshop Proceedings, Detroit, MI, 369-377.
Zembowiez, R. & Zytkow, J.M. (1991). Automated
Discovery of Empirical Equations from Data. In Ras.
Z. & ZemankovaM. eds. Methodologies for Intelligent
Systems, Springer-Verlag, 1991, 429-440.
Zytkow, J.M. (1987). Combining many searches
the FAHRENHEIT
discovery system. Proceedings of
Fourth International Workshop on Machine Learning,
Los Altos, CA: Morgan Kaufmann, 281-287.
Zytkow, J.M. & Pachowicz, P. (1989). Fusion of vision and touch for spatio-temporal reasoning in learning manipulation tasks, in: Proceedings of SPIE’s Advances in Intelligent Robotic Systems, 404-415.
Zytkow, J.M., Zhu, J. & Hussam, A. (1990). Automated Discovery in a Chemistry Laboratory, Proceedings of the AAAI-90, AAAI Press, 889-894.

