From: AAAI Technical Report SS-92-02. Compilation copyright © 1992, AAAI (www.aaai.org). All rights reserved.
DIAGRAMMATIC
1MODELLING
REASONING
IN
GALILEO’S
SCIENTIFIC
KINEMATIC
DISCOVERY:
DIAGRAMS
Peter C-H. Cheng
Department of Psychology, Camegie Mellon University,
pc2n+@ andrew.cmu.edu
Abstract
Diagramsare ubiquitous in scientific discovery and
scientific reasoning. The uses of diagramsare studied
by examiningtheir role in Galileo’s workon kinematics
and the computational benefits of reasoning with
diagrams are investigated by comparingcomputational
modelsof conventional and diagrammaticapproachesto
discovery. Diagrams provide a convenient form of
representation for experimental setups that preserve
valuable topological information about the setups.
Diagramsallow the ready-madeand powerful inference
machinery of Euclidean geometry to be used for
reasoning. Whensuitable standardization techniques
exist, diagramsfurnish a basis for reasoningabout the
magnitudesof dissimilar properties. Diagramscan be
deliberately organizedto provideperceptual clues to aid
the makingof inferences, and to act as structuredrecords
of the available information. The consequencesof this
are computationalsavings in the processesof search and
recognition. Finally, the efficiency of inferences can
also be improved by replacing expensive forms of
reasoningwith cheaperperceptual inferences.
1 INTRODUCTION
Researchersin Artificial Intelligence and CognitiveScience
are investigating scientific discoveryas one particularly
interesting area of humancognitive abilities (e.g., Shrager
&Langley, 1990a; and Cheng,in press, for a review). This
and the ubiquity of diagrams in scientific research makes
scientific discovery an excellence domain in which to
investigate the uses and benefits of reasoningwithdiagrams.
The need to study the role of diagrams has been widely
acknowledge
in the area (e.g., Langleyet al., 1987;Shrager
&Langley, 1990b; Cheng,in press).
Although, research on scientific diagrammatic
reasoningis just in its infancy, like study of diagrammatic
reasoning more generally, someinteresting findings have
already been obtained. Larkin & Simon (1987) have
demonstratedthat diagrammaticrepresentations can confer
significant computational advantages over sentential
representations, of the same informational content. The
benefit comes from the preservation of information in
diagrammaticrepresentations about the topological features
and geometric relations among the components of a
problem.This informationhelps, to different degrees, in the
processes of search, recognition and inference. Search
lThanksshould go to Herbert Simonfor the discussions that
have helped to shape this workand for his comments
on an
earlier draft of this paper. This research wassupportedby a
postdoctoral fellowship fromthe UKScience and Engineering
ResearchCouncil.
33
Pittsburgh,
PA 15213, USA.
involves finding information relevant to the problem.
Recognitionis the process of identifying rules to solve the
problem using that information. Inference is the
manipulation of the information by a pertinent rule to
produce new information as part of the solution. Other
interesting work has been done by Funt (1977), Novak
(1977), and Shrager(1990).
This paper investigates the uses and computational
benefits of diagramsin scientific discoveryby considering
examplesof the reasoning and discoveries of Galileo in his
work on kinematics. Although Galileo’s kinematic
discoveries have been computationally modelled in some
detail (Cheng, 1990, 1991), the role of diagrams has not
previously been considered. Wewill consider how:
¯ Diagrams provide a form of representation for
experimental setups that conveniently encodes valuable
informationabout the spatial properties and geometrical
relations of setups.
¯ Backgroundknowledgein the form of the ready-madeand
powerfulinference machineryof Euclidian geometrycan
be used when
information is represented
diagrammatically.
¯ Diagrammatic
standardization techniques can be used to
providebases for reasoningabout different magnitudesof
dissimilarproperties.
¯ Diagramsallow information to be organizedin waysthat
makeproblemsolving easier or moreefficient; reducing
the amountof computation in search and recognition
processes.
¯ Diagrammaticrepresentations can reduce the amountof
computation during inference processes by replacing
costly inferenceswith cheaperperceptualinferences.
Thesepoints are consideredin turn.
2 REPRESENTING EXPERIMENTAL SETUPS
Galileo wasone of the first scientists in the modem
sense,
because he not only theorized about the nature of
phenomena, but also performed carefully controlled
experiments(e.g., Drake, 1978). His experimentalskill
exemplified by his work on the motion of balls rolling
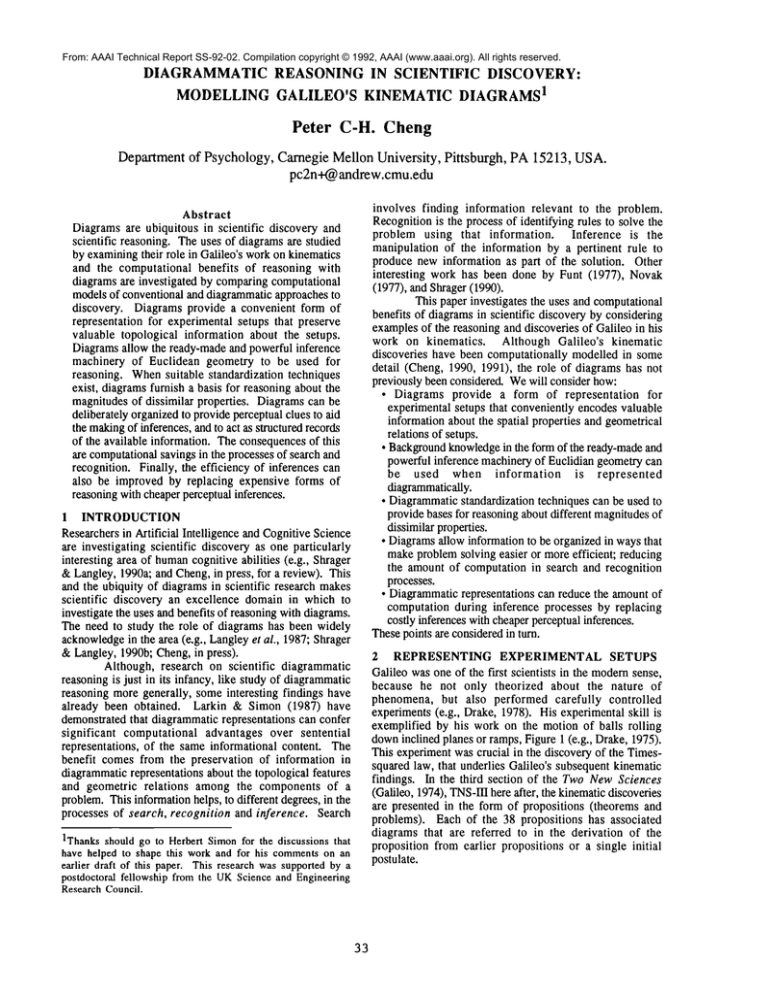
downinclined planes or ramps,Figure1 (e.g., Drake,1975).
This experimentwas crucial in the discovery of the Timessquared law, that underlies Galileo’s subsequentkinematic
findings. In the third section of the TwoNewSciences
(Galileo, 1974), TNS-m
here after, the kinematicdiscoveries
are presented in the form of propositions (theorems and
problems). Each of the 38 propositions has associated
diagrams that are referred to in the derivation of the
proposition from earlier propositions or a single initial
postulate.
- s
ball:size,
weight, volume
- T
- X
inclinedplane
~
I
height
- y
7- length
Figure 3 MeanProportional The,.0r0m
i
tST = dST¯
Substituting into Equation1, and rearranging:
tsy 2 = dST2. dsy / dST.
Fi~,ure 1 Inclined Piing Experiment
c
So,
Figure 2 Postulate Diagram
Eachdiagramis a representation of an actual experimental
setup or one that could be constructed. For instance, the
initial postulate states that the speeds of bodies descending
inclinedplanesof different lengths, but of the same(vertical)
height, will be equal. Its diagramshowstwo right angled
triangles withthe vertical sides of eachcoinciding,Figure2.
The diagram obviously preserves important geometric
features of the inclined plane experiments,Figure 1, and the
coincidenceof their verticals showsat a single glance that
the heights are equal. In general, diagramslike these are a
convenient wayto encode information about the relevant
features of an experimentalsetup, in a representationalform
that is eminentlysuitable for makinginferences, as will be
seen below.
3 STANDARDIZATION
Throughoutthe TNS-In, Galileo draws lines of the same
length to represent magnitudesthat are equal, as in the case
of the heights of the twotriangles above. Galileo also uses
a diagrammaticstandardization technique to comparethe
magnitudesof different properties. The prime exampleof
this is the meanproportional theorem, whichis the second
corollary of the Times-squaredlaw, Proposition 2 (TNS-III2). The Times-squared
law can be written as an equation;
dST [ dsy = tST 2 ] tsy 2 ....
(1)
where,d is the distance, t the time, and the subscripts denote
2.
different portionsof the descent
Galileo derived the Meanproportional theorem
from the Times-squaredlaw, using Figure 3. The lines ST
and SYrepresent the two distances travelled by a body.
Now,by choosingthe units appropriately, let the time taken
to txavel throughST also be representedby the line ST;
2Galileo usually stated his laws as sentences. For ease of
comprehension,
equationsare employed
here, withoutaffecting
the argumentsconcerningdiagrams.
34
tsY / tST = ~/(dST ¯ dsy ) / dST,
tsy / tST = 4dsy / 4dST.
... (2)
... (3)
... (4a)
... (4b)
or,
Thus, the time to cover SYis the square root of the product
of the distances ST and SY, that is, the meanproportional
of ST and SY, which is SX in the diagram. Galileo has
transformed the law into a convenient form that can be
simply applied to kinematic diagrams-- the Times-squared
law has been diagrammatically operationalized. The Mean
proportionaltheoremis fundamentalto the discoveries in the
TNS;the cases to be considered belowdemonstratehowthe
theoremis employed.
Diagrams can provide convenient means for
representing different magnitudesof similar or dissimilar
properties. By arranging lines whose lengths are in
proportion to the magnitudesin close proximity, or even
overlapping, comparisons of the magnitudes are readily
made.Lines are abstract representations of quantities that
allow techniques like the Meanproportional theorem to
provide a standard for makinginferences involving different
properties.
4 USING BACKGROUND GEOMETRIC
KNOWLEDGE
"Galileo’s theorem"(Drake, 1978), TNS-III-6, is concerned
with the times of descent along inclined planes within a
vertical circle. Figure 4 showsinclined planes runningfrom
points on the circumference
of a circle to the lowestpoint in
the circle, and planes runningto the circumferencefromthe
highest point. Galileo demonstrates that the times of
descentfor all such inclined planes are equal3. The ratio of
the time of descent along DCto DGis given by the Mean
proportional theorem, Equation4a:
tDC / tDG = 4(dDC. dDG) / dDG.... (5)
where t and d are time and distance, respectively. Now,
Galileo was well-versed in Euclidian geometry, so simple
states withoutproof that the distanceDFis equal to ~/(dDC
dDG). This can be simply proved using Pythagoras’s
theorem.Substituting into Equation5, we get:
3Galileo was unawareof rotational momentum,
so did not
realize that this theoremis onlytrue whenthere is non-skidding
rotation (or frictionless sliding) alongeveryinclinedplane.
b~~l
ae
ad
ab
ac
i
9 ~9
4~6
10--15
18--18
e
Fi~,ure 4 Galileo’s Theorem
tDC / tDG = dDF / dDG ....
(6)
Finally, TNS-III-3states the times of descent downinclined
planes of equal height are in proportionto their lengths, so
the time along DFto that along DGis given by:
IDF / tDG = dDF / dDG ....
(7)
Hence, examiningEquations 6 and 7, the time for DCand
DFare equal.
This is a good example of how Galileo used the
Meanproportional theorem to represent the problem
diagrammatically, and then employed his knowledgeof
Euclidean geometryto find a simple solution. There are
manyother similar cases in the TNS,and Galileo’s work
more generally, where the ready-madepowerful inference
machineryof geometryis used to makediscoveries once the
problemhas been transformedinto a diagrammaticform.
Prop,. 3 Prop. 2 Prop. 3
b
/ \/
a
a
a
d
f
a
I
ab 12-- 18
ae 9--9
ad 4--6
c
Figure5 Discoveryof TN$-III-~
5 PERCEPTUAL CLUES, INFORMATION
ORGANIZATION, AND SEARCH AND
RECOGNITION SAVINGS
Anothergoodexampleof the use of the meanproportional
theoremis in the discoverythat the time of descent downan
inclined plane is in proportion to its length and inversely
proportional to the square root of its height, TNS-III-5.
This discovery is also interesting because it demonstrates
howdiagramscan provideperceptual clues for inferences and
organize information in ways that makethe whole process
easier and more efficient. Figure 5 showsthe essential
extracts from the relevant page in Galileo’s note books
(f.189v, Galileo, 1979). The two right angled triangles
represent two inclined planes; again, their horizontals are
drawnalong the sameline and their peaks coincide. Below,
the wavyset of parallel lines represents distances and the
straight lines represent times. The labels indicate bowthe
lines relate to the twoinclinedplanes.
Galileo assumesthat the lengths and the heights of
the inclined planes and the time ab, are given. Thefirst step
wasto find the time ad, by applyingTNS-III-3,whichstates
the ratio of the times of descentdowntwodifferent inclined
planes(or the vertical) is equal to the ratio of their lengths;
so,
tab / tad = dab / dad ....
(8)
where,t and d are time and distance, respectively4. Thenext
step wasto find the timeto cover the distanceae, giventhat
the time to cover ad is now known. By the Mean
proportionaltheorem,Equation4b, the ratio of the times is,
tad / tae = X/dad / ~/dae ....
(9)
Thatis, the timeto travel distance ae is givenby the line af
5,
on the diagram.The third step is to apply TNS-I]I-3again
on this occasionto ae andac, to find the timeac,
(10)
tae / tac = dae / dac ....
Finally, findingthe ratio of the times of ab to ac is a matter
of combining
all the separate timerelations ab:ad, ad:af, and
af:ac; that is compounding
Equations8, 9, and 10:
tab/tac = (dab/dac). 01dae / ~/dad) .... (11)
The time of descent downan inclined plane is in proportion
to its length and inversely proportionalto the squareroot of
its height.
Clearly, the diagramshelped greatly in the making
of this discovery. Theorder of the distance lines waschosen
so that they matchedthe sequenceof inferences to be made.
As each newtime was inferred, it was placed opposite its
correspondingdistance, ready for consideration in the next
step. Finally, the three sets of time and distance pairs
providea record of the relations that needto be combinedat
the end. The dashed arrows and proposition numbershave
been added to Figure 5 to illustrate these diagrammatic
relations.
The sets of numberson the right of Figure 5 are
two separate numerical examplesthat Galileo considered.
Notethat the lengths of the distanceand time lines represent
the relative values in the examples,but are not exactly to
4Thecomment,in note 3 aboveon rotational momentum,
also
appliesto TNS-III-3.
5Fortuitously, the double application of the proposition
cancelsthe error of ignoringrotation.
35
scale.
The discovery has been modelled twice using a
production system: first, in a "conventional" manner,
without the use of diagrams; and second, using a
representation for diagrams. Becauseof limited space the
modelswill only be briefly outlined6. The conventional
modelemployssix rules. Three rules instantiate the mean
proportional theoremand two versions of TNS-[II-3. There
are also two mathematicalrules for the simple manipulation
of equations and a final rule that recognizeswhenthe goal
has been achieved. Consider for example, the mean
proportionaltheoremrule (translated into pseudoEnglish):
If the distance<S
T>anddistance<S
Y>are in_line<ST Y>,
andtime<ST>is given,
Thenthe time<SY>is givenby the equation,
time<SY>/ time<ST>=
qdistance<S
Y>/ ~,/distance<S
T>,
andignorethe distance<S
T>.
S, T, and Y are variables standingfor different points, and
for exampledistanee<S Y>meansthe distance between S
and T. This rule fires whenthere are twodistances that are
in line and havethe sameorigin, and the time to cover the
first distance is known. The rule places an equation
equivalent to Equation4b into workingmemory,notes that
the time to cover the seconddistance can be calculated, and
removesthe first distance fromconsideration.
The diagrammatic model employs the same
representations for equations, but does not have separate
expressions for informationconcerningdistances and times.
Rather, it employsa simple representation for diagramsthat
is equivalentto the parallel lines in Figure5. For example,
diagram
[dists (<ab><a d><ae><a c>)
~mes
(<ab><ad>)]
indicates that there are four parallel lines groupedtogether
representing four distances and there is a group of two
parallel lines representingtimes associatedwiththe first two
distances. The small letters are specific points and the
diagram preserves the topological relations between the
items of information. In the program diagrams are
instantiatedas nodelink structures.
The first of the six diagrammaticmodelrules has
the job of constructingan initial diagramconsisting of lines
for the lengths and verticals of the twoinclined planes anda
line for the single given time. Three TNS-IIIrules still
producethe required equations but they refer to the single
diagram rather than multiple sets of expressions. For
examplethe meanproportional theoremrule is:
[(:lists (<AB><AC><AE><AD>)
times(<AB><AC><A E>)].
The same mathematical manipulation rules are employed,
but no rule for recognizingthe gaol is required.
The run time for the diagrammatic approach was
50%faster than that for the conventional approach, even
though both cases employedthe samenumberof rules. The
computational savings come from the use of the
diagrammatic representation of the distance and time
information, and is manifested in two forms. First, the
diagrammaticrepresentation reduces amountof effort needed
to search workingmemoryon each cycle. The conventional
rules each place several expressions in workingmemory,
whereasthe diagrammaticrules modifythe single diagram
expression. As there are fewer expressions in working
memoryat each stage of the diagrammaticsimulation, the
effort to search workingmemoryfor information to match
with rules is significantly less. Second, there are more
expressionsin the condition parts of the conventionalrules
compared with the diagrammatic rules (e.g., 4 and 1,
respectively, in the two rules above). Thus amountof
processing required for each diagrammaticrule is less. In
Larkin and Simon’s (1987) terms, the cost of search and
recognitionhavebeensubstantially reduced.
This Galilean discovery showsthat diagramsallow
information to be organized intentionally to aid reasoning
processes by several means: (i) exploiting the role
proximity; (ii) grouping together diagrammaticelements
representing similar types of properties or entities; (iii)
using shared diagrammaticfeatures, such as wavylines, to
distinguishedsimilar properties or entities; and, (iv) using
the relative size of diagrammaticcomponentsto indicate
magnitudes.Suchdiagrammaticproperties aid the discovery
processby permittingdiagramsto: (i) act as a well-organized
record of the inferences already madeand the information
generated; and, (ii) serve as a sourceof perceptual clues
indicate whatinferences can be made.
In the next section we consider how Galileo
employeddiagrams to reduced the amountof computation
duringinference.
6 COMPUTATIONAL SAVINGS DURING
INFERENCE
TNS-III-30considersthe followingsituation: Giveninclined
planes runningbetweentwo parallel horizontal lines, Figure
6, what is the inclination of the plane that will give the
If thereis a diagram
[dists (<AB><AC><AE><AD>)
times(<A
B><AC>)],
Thenapplythe equation,
fime<AC>/time<AE> =
~/distance<A
C>/ ~distance<A
E>,
andredrawthe diagram
as
6Amanuscript
withfull details canbe obtainedfromthe author.
36
Figure 6 Inclined Planes BetweenTwoVerticals
b
d
Figure 7 Triangle Representingan Inclined Plan¢
quickest time of descent?The speedof the ball increases as
the inclination increases, becausethe total vertical distance
(height) of descentincreases. However,
the total distance
be travelled also increases as the inclination increases. The
problemis to find whenthe two effects combinedto produce
a minimum.The inclination for the minimumtime is 45
degrees7. Galileo did not solve this problemdirectly, but
ingeniously employed TNS-III-6 "Galileo’s theorem",
considered above, that happens to demonstrate how
diagrammatic reasoning can achieve significant
computationalsavings during inference.
Althoughthere is no record that Galileo ever solved
the problemby direct application of his laws, it is quite
feasible to do so. Consideran inclined plane dac, in Figure
7. The time of descent downthe plane is given by TNS-[II5 on uniform velocity motion:
tda=
dda
/ Vda
....
(12)
where t, d, and V are time, distance and mean speed,
respectively. The mean speed is equal to the maximum
speed at the end of the descent, Vmax,divided by two, TNSl]]-l, thus:
(13)
tda = 2. dda / Vmaxda ....
Fromthe general Lawof free fall, the terminal velocity
downan inclined plane is in proportionto the square root of
the heightof the plane; thus:
tda = 2. dda / ~/hdc ....
(14)
where h is the height. From Pythagoras’s theorem, the
length of the inclined plane can be replacedby its height and
the horizontal component
of its length, giving:
tda= 2. x/(dac 2 + hdc2) / X/hdc .... (15)
In Equation 15, tda is a minimum,for a given dac when
¯hdc=dac
These steps have been modelled using the
productionsystemwith eight rules. Thereare three rules for
the three Galilean laws; three mathematical rules for
manipulatingequations; a rule instantiating Pythagoras’s
theorem; and, a rule that gives the condition for the
minimumof equations with the same form as Equation 15.
Thelast rule is:
If thereis anequation
of theform,
7Asimple problemto solve in modernkinematics: e.g. by
finding the timeas an expressionof distanceandacceleration,
both as functionsof the inclination; and differentiating with
respect to inclination, setting to zero and solvingthe equation
to find the minimum.
37
Figure 8 Galileo’s Solution to TNS-1TI-30
PI<D A>=
2 * ~/(P4<AC>2 + P5<DC>2) / 4P5<D
c>,
Thenthe minimum
occurs whenP4<AC>= P5<DC>
as PI<DA>varies,
andignorethe original equation.
P1, P4 and P5 are variables that stand for different
predicates (e.g., horizontal or vertical distances). Notethat
this rule merely states the condition for the minimum
withoutinferring it.
The way Galileo solved the problem is shownin
Figure 8. A circle with a radius equal to the distance
betweenthe parallel lines is drawnwith its bottomat the
point of intersection of all the inclined planes. Now,
"Galileo’stheorem"states that the times of descentalong the
inclined planes within the circle are equal; tea = tha = tka.
However,as the inclined planes da andfa are longer than ha
and ka, their times of descent must be longer than times ha
and ka. Therefore, the descent time betweenthe verticals
alongthe incline ea is the shortest.
This approach has also been modelled Expression
like line<C D>and circle<A E G>described diagrammatic
elements. Six rules are employed.Thefirst rule locates the
point wherethe inclined planes intersect. The secondrule
"draws"a circle with a radius equal to the distance between
the parallel lines and its bottomon the intersection point.
Thethird rule is a perceptualoperator:
If thereis aninclined._plane<D
A>
that intersectsthe line<CD>at <D>,
andan inclined__plane<E
A>
that intersectsthe line<CD>at <E>,
anddistance<A
C>anddistance<E
C>are equal,
andthereis a circle<AE G>,
Thenseethat inclined_plane<VRBL1
A>
intersectsthe circle<AE G>at <VRBLI>,
andseethat the thesepoints are in_line<AVRBL1
D>,
andseethat the distance<D
A>is longerthan
distance<VRBL1
A>,
andignorethe facts: <D>intersectsthe line<CD>,
<E>intersectsline<CD>,terminal<A>,
distance<AC>=distance<E
C>, circle<A E G>.
G is the upper most point on the circle and VRBL1
stands
for point h in Figure 8. This rule provides informationthat
could be obtain just by looking at the diagram;for example,
that the distance da is longer than distance ha. Thefourth
rule instantiates Galileo’s theorem.Thefinal rule identifies
times that are longer than the commonminimumbecause
their respectivedistances extendbeyondthe circle.
The diagrammatic simulation runs about 12%
faster. However,the computationalcost of the conventional
approach is not truly reflected by this figure. The
diagrammaticrules are all low cost rules; seeing wherethe
inclined planes intersect, drawingthe required circle, and
spotting relations amongstdiagrammaticelements, are all
straightforward perceptual tasks. There are two kinds of
computationalexpenseshidden by the simplifications made
in the conventionalmodel.First, there are specific hidden
costs associated with someof the rules. For example,the
effort required to infer the minimumof Equation 15 is
substantial but not reflected in the rule, whichmerelystates
the minimumcondition. Galileo may have done so by
calculation, with dac set to unity, and iterating over
successive values of hdc; a protracted set of inferences.
Alternatively, he mayhave reasoned about the way the
numeratorand denominatorof Equation15 each varies with
hdc, and thus howthe overall magnitudeof the equation may
vary; a difficult set of inferences. Thesecondtype of hidden
cost is generalto all the rules in the conventionalapproach.
Galileo usually considered equations involving ratios of
terms, but the rules for modellingthe conventionalapproach
only considered individual terms. Thus, the expense of
dealing with the Galileo’s morecomplexform of notation is
absent from the model.
What the diagrammatic approach achieves is a
substantial saving during inference. Larkin and Simon
(1987) consider that the potential for inference savings
less than that for search and recognition,
when
representations are informationally equivalent. However,
this case demonstratesthere are significant inferencesavings
to be madealso, under certain circumstances. The reason
Galileo’s diagrammaticapproachis so muchcheaper, is that
it allows qualitative reasoning to be used. The difficult
tasks of manipulating quantitative expressions and,
especially, the problemof minimizinga complexequation,
are replaced by simple perceptual tasks, such as seeing
whetherone line is longer than another.
7 CONCLUSIONS
The uses and computational benefits of diagrams in
scientific discoveryhavebeen investigated by studying and
modellingGalileo’s kinematicdiagrams.
¯ Diagramsprovide a form of representation for experimental
setups that convenientlyencodevaluable informationabout
the spatial propertiesand geometricalrelations of setups.
¯ Backgroundknowledgein the form of the ready-madeand
powerfulinference machineryof Euclidian geometrycan be
used wheninformationis represented diagrammatically.
¯ Diagrammatic
techniquesfor standardizationcan be used to
provide a foundation for reasoning about different
magnitudesof dissimilar properties.
¯ Diagramsallow information to be organized in waysthat
makeproblemsolving easier or moreefficient; reducingthe
amountof computationin search and recognition processes.
¯ Diagrammaticrepresentations can reduce the amountof
computationduring inference processes by replacing costly
38
inferenceswith cheaperperceptualinferences.
In recent research (Cheng& Simon,submitted)
have used these findings to demonstratethat Galileo would
have been able to discover the conservation of momentum
using a diagrammaticapproach.
REFERENCES
Cheng, P.C-H. (1990). Modelling Scientific Discovery.
Technical Report No.65, HumanCognition Research
Laboratory, The Open University, Milton Keynes,
England.
Cheng,P. C-H.(1991). Modellingexperimentsin scientific
discovery. Proceedingsof the 12th International Joint
Conferenceon Artificial Intelligence. MountainView,
CA: Morgan Kaufmann.
Cheng, P. C-H.(in press). Approaches,modelsand issues
in computationalscientific discovery. In M.T.Keane&
K. Gilholy. Advances in the Psychology of Thinking
(Vol. 1). Harvester-Wheatsheaf.
Cheng, P. C-H. & Simon, H. A. (submitted) The right
representation for discovery: Could Galileo have
discovered the conservation of momentum?
Submitted
to The 9th International MachineLearningConference,
Aberdeen,July 1992.
Drake, S. (1975). The role of music in Galileo’s
experiments. Scientific American,232,98-104.
Drake, S. (1978). Galileo at Work. Chicago:University of
ChicagoPress.
Funt, B.V. (1977). Whisper: A problem-solving system
utilizing diagrams and a parallel processing retina.
Proceedingsof the Fifth International Joint Conference
on Artificial Intelligence.
Galileo Galilei. (1974) Two new sciences. S. Drake
(Trans.). Madison,Wisconsin:University of Wisconsin
Press.
Galileo Galilei. (1979). Galileo’s Notes On Motion. S.
Drake (Ed.). Annali dell’Instituto e Museodi Storia
della Scienza.Florence,Italy.
Langley, P., Simon, H.A., Bradshaw, G.L. & Zytkow,
J.M., (1987). Scientific Discovery: Computational
Explorations of the Creative Process. Cambridge,MA:
MITPress.
Larkin, J.H. & Simon, H. A. (1987). Whya diagram
(sometimes) worth ten thousand words. Cognitive
Science, 11, 65-99.
Novak, G.S. (1977). Representations of knowledgein
programfor solving physics problems. Proceedingsof
the 5th International Joint Conferenceon Artificial
Intelligence.
Shrager, J. (1990). Commonsenseperception and the
psychology of theory formation. In J. Shrager & P.
Langley, (Eds.). ComputationalModelsof Scientific
Discovery and Theory Formation (437-470). San
Mateo, CA: Morgan Kaufmann.
Shrager, J., & Langley, P. (Eds.) (1990a). Computational
Modelsof Scientific Discovery and TheoryFormation.
San Mateo, CA: Morgan Kaufmann.
Shrager, J. & Langley, P. (1990b). Computational
approachesto scientific discovery. In J. Shrager &P.
Langley, (Eds.), ComputationalModelsof Scientific
Discovery and Theory Formation (5-25). San Mateo,
CA: Morgan Kaufmann.


