From: AAAI Technical Report SS-94-05. Compilation copyright © 1994, AAAI (www.aaai.org). All rights reserved.
Shape- Based Trackingand Analysis of MyocardialFunction from 4D
Images
J. S. Duncan,P. Shi, A. Amini,T. Constable,andA. Sinusas
Departments
of Diagnostic Radiology,Medicine,andElectrical Engineering
Yale University
New Haven, CT 06520
Abstract
."his paper is a status report of work- in- progress,
unded by the National Heart, Lung and Blood Institute
NHLBI)of the National Institutes
of Health (NIH),
hat is aimed at more accurately and objectively deteraining and quantifying the regional and global function
f the left ventricle (LV) of the heart under both noraal and ischemic conditions, fundamentally relying on
omputer vision- like models and strategies.
"1
Introduction
’he quantification of left ventricular (LV) regional func.on from diagnostic images permits clinically important
leasurements to be made that are crucial for managlg patients with ischemic heart disease. However,such
leasurements have been hampered by limitations
in
mventional imaging and image analysis methodology
nat have commonlybeen applied in the clinical arena
date. These limitations have prohibited the accuLte regional assessment of myocardial injury and/or the
rediction of vessel patency, and include the facts that:
) most conventional imaging methods provide twoimensional (2D) temporal slice or projection sequences
:.g. see [4]), that cannot possibly permit viewing or
aalysis of the true motion of the heart, which rigidly
roves and non- rigidly deforms in a three- dimensional
ID) space. 2.) Most approaches to regional imageased analysis of LVfunction : a.) make gross and rerictive assumptions about the general direction of LV
Lotion or thickening (e.g. towards a center of mass.]) and b.) utilize only the end diastolic (ED) and
,stolic (ES) image frames (e.g. [3]), ignoring the
lat the LVactually goes through a temporal wave of
retraction and that the asynchrony of surface motion
" LVthickening from region to region maybe indicative
: ischemia.
Our current research utilizes techniques from comater vision to analyze 3D cardiac image sequences in
¯ der to more accurately estimate regional LVfunction,
ld is muchmore adaptable to the nonlinear, non- rigid
gional motion of the LV than the techniques based
165
on the restrictive
assumptions mentioned above. The
approach is based on the use of non-invasive, threedimensional (3D), cardiac diagnostic imaging sequences
(i.e. four-dimensional (4D) data) acquired from any
of a number of modalities- currently 3D cine Computed
Tomography (CT) acquired from the Dynamic Spatial
Reconstructor (DSR) at the Mayo Clinic and cardiac
Magnetic Resonance Image (MRI) data acquired at our
ownfacility and soon to be tested on 3D transesophogeal
echocardiographic data. Our image analysis methodology follows the shape properties of the endocardial
and epicardial surfaces of the LVover the entire cardiac cycle, based on locating and matching differential
geometric landmark features and using a mathematical optimization reasoning strategy to combine smoothness models with data- derived information. In some
respects, this approach has similar goals as other recent
efforts in the medical imaging community that utilize
the unique characteristics of MRimaging techniques to
track cardiac wall motion and function: MRtagging
(e.g. [2]) and phase- contrast velocity imaging ([6]).
is of interest to note that the shape- based approach can
derive quantitative parameters of LVfunction similar to
those derived from these MRI- based approaches, yet is
not restricted to using only MRIdata.
2
Image Analysis
Methods
Surface segmentation.
The 4D image datasets are
first segmentedby treating the data as if it consisted of
a sequence of temporal frames where there exists a spatial stack of 2D images in each frame. Wesolve the 2D
boundary finding problem twice in each image, once for
the epicardial border and once for the endocardial border using a deformable contour approach that we have
developed for 2D boundary finding [7]. The boundaries
found in this plane are nowused as a bias and initial estimate for locating the endocardial and epicardial boundaries in the next plane in the stack. This process repeats
until all of the contours that make up the LVsurfaces
in each frame are completely located. Finally, the contours that form the endocardial and epicardial surface
in each 3D frame are stacked and then sent to a surface
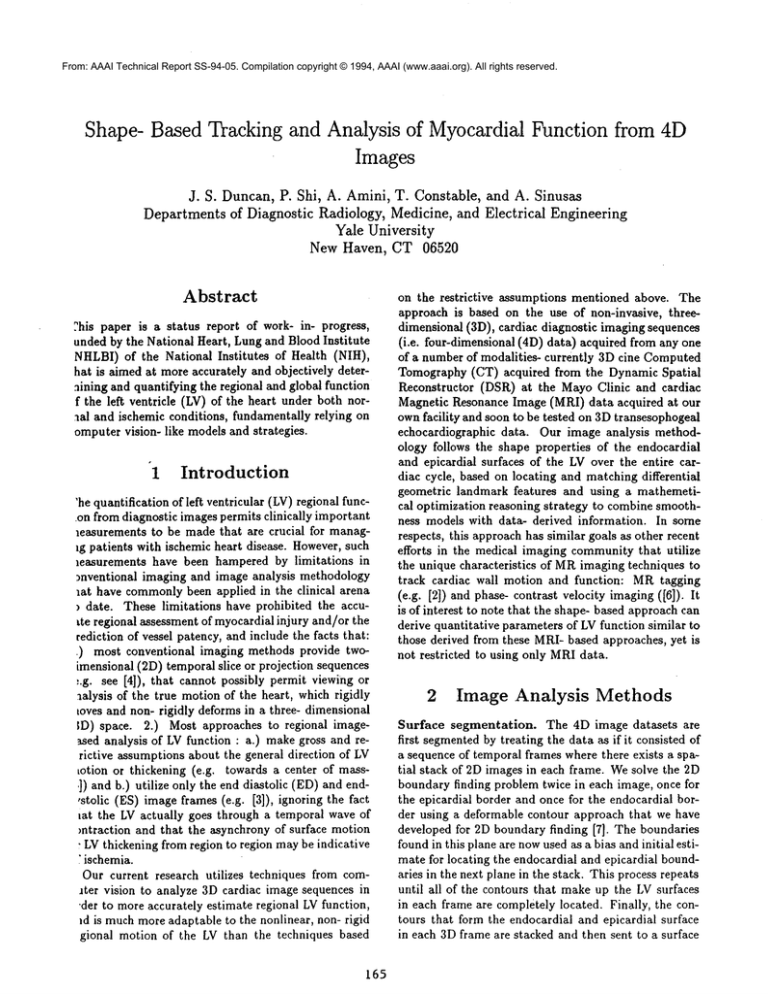
Figure 1: Gray scale renderings of color- coded bending
energy maps of four, temporally- consecutive endocardial surfaces of the dog heart in its normal, or baseline,
state. The sequence progresses as follows: upper left,
upper right, lower left, lower right.
Theprincipal
curvatures
of a surface
patchat timeto
are givenwithno bars,whilethe sameparameters
at
timeto + ~t (within
a searchwindowon thesecondsurface)arespecified
withbars.Thisequation
arrives
at
numerical
valuemeasuring
theenergythatwasrequired
to deformthesurfacepatchsurrounding
surface
point
(u,v)at timetoto achieve
a particular
shapeata test
position
withina searchwindowat timeto + 6t.Each
of the~t(’~’~)~+~("’~f
. termsin thisequation
canseparatelybe seenas computingthe amountof bending
energyrequired
to benda thin,flexible,
fiatplateto
theshapeof thesurface
patchsurrounding
point(u,v).
Pseudocolor
mapsof thelocalbendingenergies
can be
displayed on top of surface renderings of the LV. A gray
scale display of such mappings/renderings is shown in
figure 1 for four sequential endocardial surfaces, reconstructed from a MRI4D acquisition. The result of the
matching process specified by equation (1) essentially
compares the maps displayed in figure 1 and yields a set
of initial shape- based, best-match vectors, D0(u, v), for
pairs of surfaces derived from the 4D image sequence, as
well as information about the uniqueness of the match
within each search region. This information is now sent
to a regularizing functional that will include terms to
smoothover(u,v)surface
space:
CD(U,v)[D(u,v) - D0(u,
tesselation
algorithm
thatwe haveimplemented,
which
typically
creates
roughly
15,000
triangles
perDSR-derivedendocardial
surface
and3,000triangles
perMRIderived
endocardial
surface.
Shape- based motion tracking. As mentioned
above,themovement
overtimeof a set of LV surface
pointsis performed
by following
localsurface
shape.
Our approach
reflects
furtherdevelopments,
improvementsandmodifications
to ourearlier
efforts
in this
area[I].Thedensesetof points
foundfromtesselating
thesurfaces
areusedto guideshapecalculations.
Betweenany2 surfaces,
shapematching
is firstperformed
throughthe use of a metricbasedon comparing
surfacepatches
usingbending
energy.
Thebasicideais to
matcha surfacepatchon a 3D (endocardial
or epicardial)surface
foundfroman imageframeat timet with
a surface
patchwithina regionof surface
patches
on a
corresponding
3D surface
foundfroman imageframeat
timet + 6t, usingmeasurements
of the patches’
mean
andGaussian
curvatures.
We modelthesurfacepatches
as elastic
thin-plates,
wheretheenergyneededto bend
eachplateawayfromanyarbitrarily
formedinitial
surfaceto a deformed
stateis
2
v)]
(i)
166
-t
OD(u,v) du
0u
In this equation, U, V is the domain of the surface at
time t in which the finite element grid from the Delaunay triangulation is embedded, u - [uv] T is the position
of the end of the vector D(u, v) on the surface found
time t, D* (u,v) is the optimal smoothed motion vector field between any two surfaces found at times t and
t + ~ft, Do (u,v) is the initial motion vector estimate,
and CD (u,v) is the confidence measure matrix from the
initial estimation, which weights the overall goodness of
the initial match as well as the match uniqueness within
the search area. While this model currently serves as a
spatial smoothness model for the vector field, the bulk
of our current efforts are aimed at incorporating appropriate temporal models as well. The solution of this
functional will yield a set of smoothedflow vectors that
better estimate true local LVmotion. It should be clear
that ultimately strong, unique matches, according to
the bending energy match measure, that last over several frames, are weighted via the confidence measures to
be the most influential
shape- based landmarks. Flow
vectors running through the knot points of the surface
patches are connected in order to form trajectories that
track individual points’ motion over the entire cardiac
cycle. The current strategy is to estimate and track
the trajectories of motion of a dense field of points that
sample the LV endocardial and epicardial surfaces at 1
point in time, over the entire cardiac cycle. The results
’igure2: Algorithmcomputed
trajectories
of several
ndocardial
points
forthenormal
or baseline
heart.The
rajectories
beginat theend-diastolic
surface
andend
t theend-systolic
surface
(rendered
here).
timecine ComputedTomographic
Imaging(usingdata
fromtheDynamic
Spatial
Reconstructor).
TableI illustratesthecomparison
of bendingenergy-derived
measuresfroman infarcted
heartderivedfromDSR image
datato the samemeasuresderivedfromthe manually
trackedmovement
of fourimplanted
endocardial
markers(i.e.thegoldstandard)
derived
fromthesameimages.Thesecomparisons
weremadeusingonlytheraw,
unsmoothed
curvedness
vectors
D0(u, v) to performthe
matching
fromwhichthealgorithmbasedtrajectories
werederived.
Ultimately,
ourgoalis tobetter
distinguish
andcharacterize
thespatial/temporal
extent
andfunction
of regionsof ischemia
andinfarction
in theLV wall,as well
as gaininsight
intoLV post-MI remodeling.
Thus,furtherstudies
are underway
to compare
thesealgorithmderived in vivo measures to measures of post mortem
injury. By studying a spatially dense set of points
that sample the LV wall’s surfaces over many temporal frames within a cardiac cycle and over a range of
conditions of LVwall abnormality, we will be able to
better understand the regional and global physiological
processes associated with ischemic heart disease.
4
f computingseveral of these trajectories in the anteropical region of the heart from MRI-derived endocardial
arfaces, are shown in figure 2. LV motion and function
1dices are then derived from these trajectories, and inlude i.) the sum of the magnitudes(lengths) of the flow
ectors, or path length Lpath,a(h, i), ii.) the shape
he path (comparedto a linear trajectory), spath,a(h, i)
nd iii.) the peak velocity within the path, vp~ak,~,(h, i).
:ach of these measures are recorded for each trajectory,
ldexed by i, on each heart being studied, indexed by h.
i general, these trajectories will be used to create quantative measures of endocardial surface motion and LV
fickening/strain.
3
Experiments
and Results
’he methodology
is currently
beingvalidated
using
)mputer
simulations
of linearly
deformable
objects
and
nagedataacquired
fromacutedogstudies.
Theacute
ogswillhaveimage-distinguishable
markers(radiopaquewiresfor cineCT and a combination
of copper
lugs(endocardium)
and a gadolinium/water
mixturefledpellet
(epicardium)
forMRI)sewnto theLV wall.
Imagesfrom3 slicesof a single3D framefroma 4D
IRIacquisition
areshownin figure
3. Thearrows
point
) the markers(darkvoidson the endocardium
and
rightspotson theepicardium).
Thevalidation
testLg is beingperformed
utilizing
datafrom5 studies
acuiredfromeachoftwodifferent
imaging
modalities
(i.e.
~e current
testsetconsists
of ten4D datasets):4D
¯ ted/cineMagnetic
Resonance
Imagingand 4D real167
Summary
In the workshop presentation of this paper, we have described a shape- based LV motion tracking algorithm,
the image data we are using, and the graphical methods
being used to visualize the results. In addition, we have
presented initial qualitative and quantitative data aimed
at comparing the algorithm- derived motion trajectories
to those found using implanted marker gold standards.
Further methodology work continues along the lines of
developing improved temporal models for motion tracking, including incorporating additional differential geometric features into the matching algorithm and forming
more complete 4D visualization approaches. Validation
and clinical experimentation continues based on the in
vivo acute infarct models and using DSRand MRimage
data.
Acknowledgements
The authorswouldliketo thankDr. ErikRitmanfor
the DSR datafromwhichthe resultsin TableI were
computed,
andDrs.F. LeeandT. McCauley,
forearlier
discussions.
Thisworkwas fundedby NIH-NHLBI
grant
R0144803.
References
[1] A. A. Amini and J. S. Duncan. Bending and
stretching models for Iv wall motion analysis from
curves and surfaces. Image and Vision Computing,
10(6):418-430, 1992.
EN DOCAR
DI L’&
SLICE 6
EPICARDIA L¢. MARKERS
SLICE 7
SLICE 8
Figure 3: Three slices from the same 3D MRItime frame, illustrating
the paired markers used for motion trackin~
validation (white arrows= epicardial markers, black= endocardial markers).
Marker
no.
1
2
3
4
/~s
¢r6
, path length
Leath,gold l L path.al~ [
29.77
30.48
36.38
25.28
23.89
31.65
32.15
26.48
6p,,th
r
0.71
11.10
7.76
5.67
6.31mm
3.77mm
displacement length
Ldi’p,g old I Ldisp,alg
6disp
12.02
17.47
13.64
12.42
15.44
15.27
12.02
12.44
3.42
2.20
1.62
0.02
1.81mm
1.22mm
Table 1: Table of path lengths (Lpath,~) and complete path displacements (L~isp,a) at four endocardial marke]
positions of a single heart. These data were computed using lmm3 4D DSRimage data, and compare algorithm.
computed trajectories (ct = alg) to the trajectories of implanted markers (ex = gold). Note that P6 and er6 represent
the means and standard deviations of the differences in the measurements.
[2] L. Axel and L. Dougherty. MRimaging of motion
with spatial modulation of magnetization. Radiob
ogy, 171:841-845, 1989.
[3] E. L. Bolson, S. Kliman, F. Sheehan, and H. T.
Dodge. Left ventricular segmental wall motion - A
new method using local direction information. In
Proc. of Computers in Cardiology, 1980.
[4] S. Collins and D. Skorton. Cardiac Imaging and Image Processing. McGrawHill, NewYork, 1986.
[5] D. Zisserman et al. Cardiac catheterization and angiographic analysis computer applications. Progress
in Cardiovascular Diseases, XXV:409-434,1983.
[6] N. J. Pelt, A. Shimakawa, and G. H. Glover. Phase
contrast cine MRI. In Proceedings of the 8th Annual
SMRM,page 101, Amsterdam, 1989.
de[7] L. Staib and J. S. Duncan. Parametrically
formable contour models. IEEE Trans. on Part.
Anal. and Mach. Intell., 14(11):1061-1075, 1992.
168

