From: AAAI Technical Report SS-94-05. Compilation copyright © 1994, AAAI (www.aaai.org). All rights reserved.
Eliminating
Errors in Image Matching
Failure of Heuristics*
Caused by the
Gall Markovich and Michael Skolnick
Departmentof ComputerScience
Rensselaer Polytechnic Institute
Troy, NY12180
Comparison
Abstract
Algorithm
Two-dimensional Electrophoretic gels (2-D gels) are
made by inducing a sample of a protein or DNAfragment of biological interest to migrate in two-dimensions
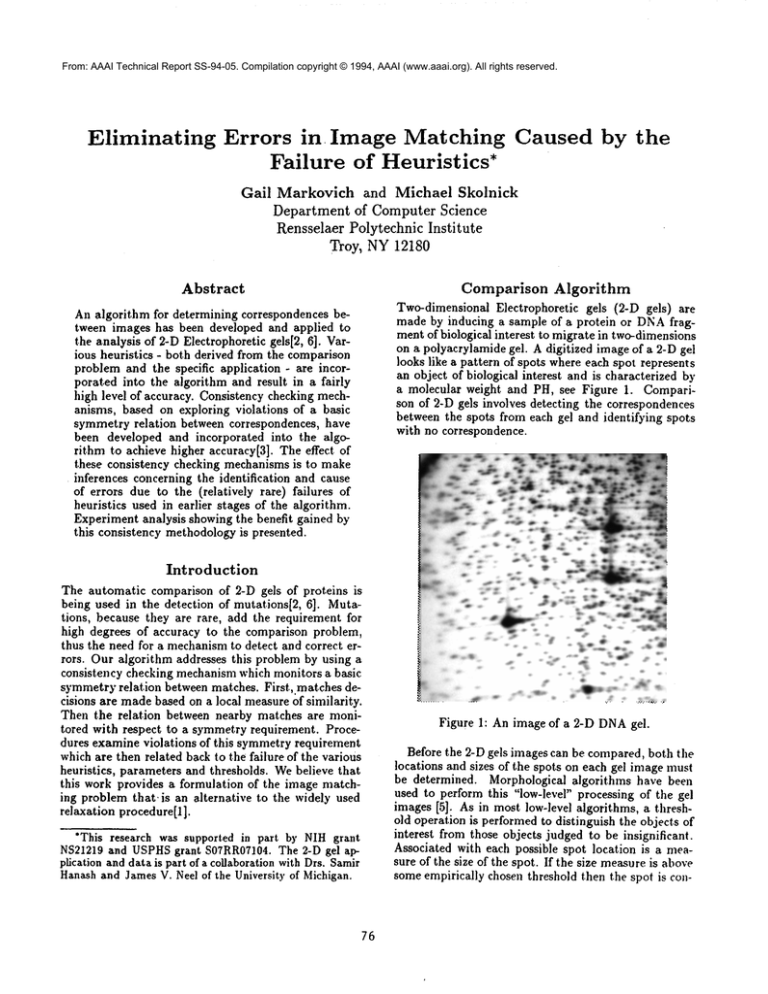
on a polyacrylamide gel. A digitized image of a 2-D gel
looks like a pattern of spots where each spot represents
an object of biological interest and is characterized by
a molecular weight and PH, see Figure 1. Comparison of 2-D gels involves detecting the correspondences
between the spots from each gel and identifying spots
with no correspondence.
An algorithm for determining correspondences between images has been developed and applied to
the analysis of 2-D Electrophoretic gels[2, 6]. Various heuristics - both derived from the comparison
problem and the specific application - are incorporated into the algorithm and result in a fairly
high level of accuracy. Consistency checking mechanisms, based on exploring violations of a basic
symmetry relation between correspondences, have
been developed and incorporated into the algorithm to achieve higher accuracy[3]. The effect of
these consistency checking mechanisms is to make
inferences concerning the identification and cause
of errors due to the (relatively rare) failures
heuristics used in earlier stages of the algorithm.
Experiment analysis showing the benefit gained by
this consistency methodologyis presented.
Introduction
The automatic comparison of 2-D gels of proteins is
being used in the detection of mutations[2, 6]. Mutations, because they are rare, add the requirement for
high degrees of accuracy to the comparison problem,
thus the need for a mechanismto detect and correct errors. Our algorithm addresses this problem by using a
consistency checking mechanismwhich monitors a basic
symmetry relation between matches. First,.matehes decisions are madebased on a local measure of similarity.
Then the relation between nearby matches are monitored with respect to a symmetry requirement. Procedures examine violations of this symmetry requirement
which are then related back to the failure of the various
heuristics, parameters and thresholds¯ Webelieve that
this work provides a formulation of the image matching problem that ~is an alternative to the widely used
relaxation procedure[l].
*This research was supported in part by NIH grant
NS21219and USPHSgrant S07RR0?104. The 2-D gel application and data is part of a collaboration with Drs. Samir
Hanashand James V. Neel of the University of Michigan.
76
Figure 1: An image of a 2-D DNAgel.
Before the 2-D gels images can be compared, both the
locations and sizes of the spots on each gel image mus~
be determined. Morphological algorithms have been
used to perform this "low-level" processing of the gel
images [5]. As in most low-level algorithms, a threshold operation is performed to distinguish the objects of
interest from those objects judged to be insignificant.
Associated with each possible spot location is a measure of the size of the spot. If the size measureis above
some empirically chosen threshold then the spot is con-
idered to be in a set of spots to be initially matched
,y the comparison algorithm. Thus, the input to the
,asic comparison algorithm is a set of points from each
alage divided into above and below threshold groups.
3asic
Algorithm
?he first step in comparing the sets of points in the
.bore threshold group is to determine the neighbors of
ach point. The neighbors provide the edge relationship
f the graph structure used in the matching algorithm.
everal graph structures are possible. Figure 2a and 2b
ontain examphs of neighborhoods from two gels being
ompared.
In the next step, the comparison algorithm deterlines a set of initial matches between the gel images,
ased on a comparison of the neighborhoods. A test on
pair of points, one from each image, is performed by
~king a cross-correlational measure (match score). As
lustrated in Figure 2c, potential matching spots (1001
nd 1002 from Figures 2a and 2b) are centered at
)mmonorigin, and the degree of clustering in the relrive positions of the neighbors of the match candidates
determined by a cross-correlation measure. The rel~ive locations of neighboring spots from the two gels
:e circled on Figure 2c when they "cluster" according
the cross-correlational measure. A positional noise
tnction, applied to nearest neighbors from different
.~]s, determines each cluster. The noise function dexmines the maximal allowable positional variation in
Lch cluster as a function of the clusters distance from
Le origin. The number of clusters determines the candates match score. A threshold on the match score
~.termines the matches.
The control flow of the basic matching algorithm is
~sed on a "committed" heuristic. Essentially this is
non-backtracking search strategy where the "clusred" pairs of a match become potential match hy)thesis.
The neighbors that cluster by a matched
~ir are considered match candidates, or "matches"
~ad quote matches) and are placed on a queue for
termining if they match by the correlation measure.
~e non-backtracking "committed" approach prohibits
y point that has previously been queued from beplaced on the queue again regardless of whether or
.t it has been matched previously or failed to match.
) initial matching pair (seed match) must be found
begin the process. This is achieved by testing pairse, spots from a small region on each gel, using the
)ss-correlational
measure technique. The seed match
=hosen as the pair in the region with the highest meare, and is placed on the queue.
Generally, the set of "matches" in a matching pair,
I1 not contain all the possible "matches". Reasons
¯ this are that 1. spots detected on one image may
ve a corresponding spot on the other image that was
t detected due to the threshold used in processing
.~ gel images, and 2. there may be genuine differ:es between the images, in which case there may be
77
no point to participate in a match. For example, in
Figure 2c, point 1041 is an isolated neighboring spot
that formed no cluster. In order to determine whether
such non-correspondences are real or not (reflect variations about a threshold or not) the image comparison
algorithm searches the original image data for belowthreshold spots that wouldreconcile the differences. If
a below threshold spot is found, the newly found spot
is added to the set of spots participating in the matching procedure. If no below-threshold spot is found, the
comparison algorithm may create a "virtual" spot in
its place (governed by a nearest neighbor heuristic in
determining creation and placement). A virtual acts
as a marker of differences between images. The newly
added points can then participate in the matching process and can be considered as "match" hypotheses for
further testing.
This basic matching algorithm results in a initial set
of matches. Note the use of various heuristics (e.g., the
graph structure, nearest neighbor bias in the clustering) thresholds (e.g., on the match score) and parameters (e.g. the noise function). As in all such heuristics,
these tend to work as expected for the most part. These
simple rules generate correspondences with an accuracy
of about 80%for this application, at little computational cost. However, the use of these heuristics does
introduce some uncertainty into the match decisions.
As a result the set of matches produced is incomplete
and has someerrors particularly in locations of the gel
that vary from the assumed heuristics and parameters.
Therefore, a final consistency checking method will be
used to detect the relatively infrequent failures of the
heuristics and parameters and invoke additional procedures to diagnose and correct these errors.
Consistency
The consistency checking mechanism involves monitoring a basic symmetry relation between matching pairs.
Specifically, nearby pairs of matching spots are expected to contribute to each others correlational measure whenthe two pairs are consistent. For example, in
Figure 2c the circled neighbors should becomematches
with the centered pair contributing to each of their correlational measures.
This pairwise symmetry is efficiently monitored between all pairs of matches using graph and matrix data
structures as in Figures 2d and 2e. The nodes in this
graph are labeled by pairs of spots (i j) where node (i
is entered into the graph if node i and node j from the
original graphs were determined by the basic algorithm
to match or "match’(cluster by a match). Note that
(ij) is involved in both a match and "match" only one
node is created, with the distinction between match and
"match" embodied in the graph edges. Consistency is
based on maintaining the following symmetric relationship between nodes in the "m’/m graph:
1. A pair is consistent with the current set of
matches when all of the nodes adjacent to it have
an edge coming back from it.
For example, in the graph of Figure 2d depicts the
match of Figure 2c. Note that two of the pairs
(1052,1051 and 1082,1071) which cluster in Figure
did not meet the symmetry requirement and are considered inconsistencies.
This happens when for some
reason to be determined latter by the algorithm an independent cross-correlation
of (1052,1051) and
(1082,1071) did not occur or fell below the threshold
on the match score.
Isolating and diagnosing inconsistencies involves a
systematic exploration of violations in the symmetry
of the edges of the graph. The method for identifying
violations in symmetrybegins by tabulating the counts
of in and out edges for each node in the graph in to
a matrix, as seen in Figure 2e. Each entry in the matrix contains two counts: the match score, which is the
number of out edges, and the "match" score, which is
the number of edges going into the node. The following two conditions characterize consistent symmetrybetween matches and "matches" in the matrix representation:
1. if the match score and "match" score of the idth
entry of the matrix are equal in value (in degree
out degree for node (id)),
2. if no other row or column coming out of i or j
contains a non-zero "match" score (node labels are
unique).
The submatrix in figure 2e corresponds to the portion
of the graph in Figure 2d. Note the inconsistency in the
graph appears in the matrix in rows 1001, 1031, 1071
and columns 1002, 1012, and 1082.
Violations of the symmetryrelation are searched for
in these data structures and the search gives rise to information on inconsistencies in the set of matches and
provides
Mternative
andpossibly
moreconsistent
match
pairs.
Thatis,patterns
of symmetry
violations
existin
thedatastructures
thatcanbe directly
(andcausally)
related
backto earlier
failures
of various
heuristics.
Identifying
thesepatterns
is thebasisforadditional
computation
thatselectively
focuseson therepairof
therelatively
smallnumberof errors.
Forexamples
of
thesepatterns
andthe procedures
developed
to diagnosing
andcorrecting
errors,
see[3,4].
Experiments
and
Results
See [2] and [6] for performance results with respect to
the detection of mutations. Additional experiments
were done in order to evaluate the consistency methodology. These tests demonstrate the ability of this
methodology to identify
errors generated by theuse
of the heuristics in the Basic Algorithm. In addition, results indicate that contextual information is incorporated into the matching process to disambiguate
matches on regions of the gel containing significant, image differences.
78
The experiments involve first examining the match
scores between all pairs of possible matches on each gel
and identifying
possible matches by maximummatch
scores. This is an exhaustive procedure (computationally costly) to identify matches based only on a similarity measure of local regions (the match score). Next,
these possible matches are compared with the matches
resulting from the Basic Algorithm, revealing that the
heuristic search of Basic Algorithm operates as well as
the complete search 90%of the time. The 10%different
from the Basic Algorithm are detected as errors by the
consistency algorithm and are corrected.
Similarly, comparing again the matches determined
by the match score only (which contain no consistency
information), are comparedwith the matches after consistency checking procedures have been applied. On average, 80%of these matches are the same. Of the 20%
that are different, 85%of the matches indicated by" the
consistency measure are the correct matches, compared
to only 10%using just the match score. Uponcloser examination, it is noted that the differences between the
matches generated by these two procedures occur in regions of the gel pairs that have considerable differences.
A formal analysis of this consistency methodology and
a more direct comparison to other techniques used in
image matching which enforce consistency, for example,
relaxation, is underway.
References
R.
Hummel
and
S. Zucker. On the Foundations
[1]
of Relaxation Labeling Processes. IEEIS Transactions on Pattern Analysis and MachineIntelligence,
5(3):267-286, 1983.
[2] R. D. Kuick, M. M. Skolnick, S. M. Hanash. and
J. V. Neel. A Two-Dimensional Electrophoresisrelated Laboratory Information Processing System:
Spot Matching. Electrophoresis, 12:736-746, 1991.
[3] G. Markovich, M. Skolnick, and M. Core. A New
Methodologyfor Isolating and Diagnosing Inconsistencies in Image Matching, as Applied to the Analysis of 2-D Electrophoretie Gels. In IEEE Workshop
on Applications of ComputerVision, pages 197-204,
1992.
[4] Gail Markovich and Michael Skolnick. A Consistency Algorithm that Systematically Eliminates Errors Generated by the Use of Heuristics, Parameters
and Thresholds in Image Comparison. Technical Report 94-2, Rensselaer Polytechnic Institute, 1994.
[5] M. M. Skolnick. Morphological algorithms for
the automatic analysis of 2-D electrophoretic gels.
Conpuler Vision, Graphics and Image ProcessilTg.
35(3):306-332, 1986.
[6] M. M. Skolnick and 3. V. Neel. An Algorithm for
Comparing Two-Dimensional Electrophoretic Gels,
with Particular Reference to the Study of Mutation.
Advances in HumanGenetics, 15:55-160, 1986.
1042
1021
1032
1011
1052
1061
1031
1012
1041
1022
1061
I O62
1092
1081
1071
1091
1002
1072
®
1041
1022
1091
1072
1002 1012 1032 1042 1052 1062 1082 1092
1001 7"6 .... 1"
1011
8,,8,,
1021
1031
1051
1061
1071
1081
79
9.9.
"1" 9"9"
8 "9"
8 "8"
"5"
7,,7,,

