From: AAAI Technical Report SS-94-01. Compilation copyright © 1994, AAAI (www.aaai.org). All rights reserved.
Onthe Useof Statistical, NeuralNetand MachineLearningTechniquesto Find Structure
in MedicalData: A CaseStudywith the Diabetes Dataset.
StephenH.Zeller
ExpertEconomics
P.O. Box173, Haverford,PAUSA
steve@expecon,com
Summry
The model
Thediabetes dataset is characterizedby
a limited numberof independentvariables and
the existenceof strong prior informationabout
the nature of causality thoughtto exist. Consequently,careful statistical modelingusingmodemtechniquesshouldbe able to do a goodjob
in determiningwhatthe underlyingrelationships are. It of great interest, however,
to see
howwell alternative approaches-- that require
less interventionon the part of analysts-- can
compareto the statistical modelingapproach.
Twosuch alternative approachesto knowledge
discoveryare examined.Thefirst is basedon
induction andtakes two forms:tree basedregression andthe C4.5algorithmof Quinlan.
Thesecond employsa simple neural net and
backpropagationalgorithm. Theresults from
these two alternative approachesare then comparedto the statistical modelresults.
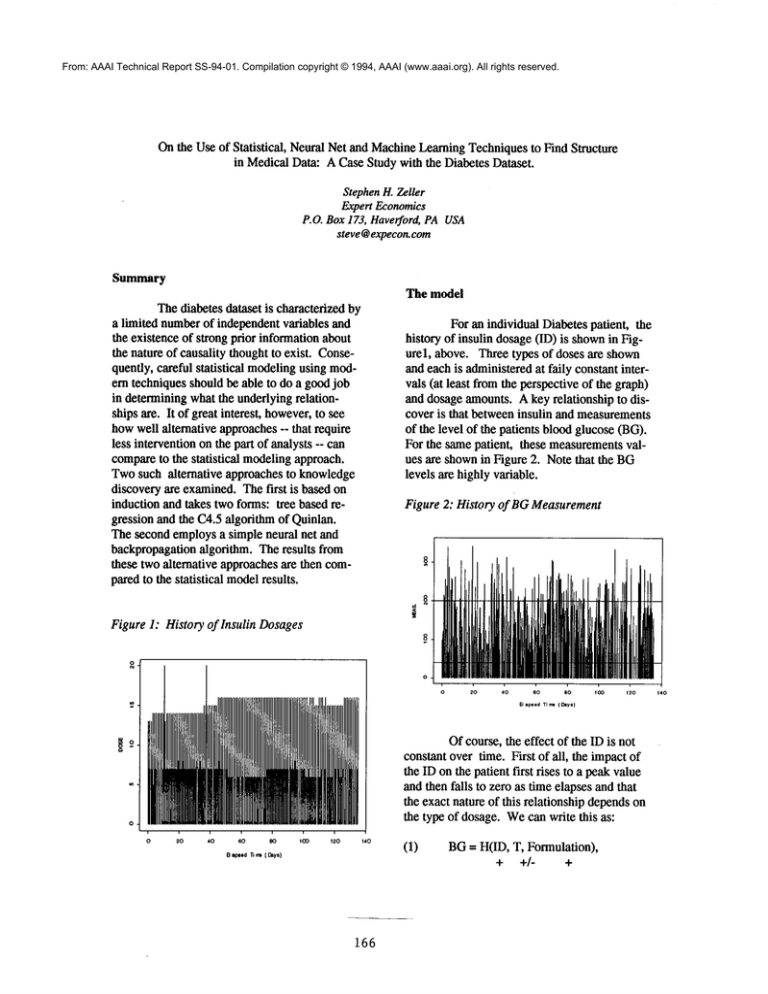
For an individual Diabetespatient, the
history of insulin dosage(ID) is shownin Figurel, above. Three types of doses are shown
andeachis administeredat faily constantintervals (at least fromthe perspectiveof the graph)
and dosageamounts.Akey relationship to discover is that betweeninsulin and measurements
of the level of the patients bloodglucose(BG).
For the samepatient, these measurements
values are shownin Figure 2. Note that the BG
levels are highlyvariable.
Figure 2: History of BGMeasurement
FigureI: History of Insulin Dosages
IIIIIllllllllllllMIIIII
Illlli
L ;o
,~,
,;o
El aple~lTIn((:~yl)
Of course,the effect of the ID is not
constantover time. First of all, the impactof
the ID on the patient first rises to a peakvalue
andthen falls to zero as time elapsesandthat
the exact nature of this relationshipdependson
the type of dosage.Wecan write this as"
20
40
60
eO
1¢0
120
140
e al~ed1~ml(Oaya)
166
(1)
BG= H(ID,T, Formulation),
+ +/+
AI-Med Abstract
February 5, 1994
where T is elapsed time and Formulation is one
of three possible types (Regular, NPHand UItralente). The expected signs of each independent variable appear below the variable name.
o
This function is based on prior work in
the field and can be used to computean effective ID fiDE) for any point in time. In particular, it can be used to computeIDEfor each time
of measurementfor BGlevels.
¯
o",..
o
o
~
"’"-.. .... ~..4oo
o ~
o
o
o
o
o
o o
8
ooo
2
o
o
~ o
"~-..
o
4
oo
~,
o
~"~r .........
.Q...........
o °o 0% oO°Oo o
~o o
o o ~,
o
o
o
o
oo o
--~..._.~
....
o
o o
o oO 0
o
£
Figure 3: Effective Dose History
o
oo
o o
o
o
e
oo o o
o
o
o
o
6
10
0090:~d34
Second,exercise plays a role:
(2)
0
2D
40
eO
80
I(]D
BG= {
120
( El(E, T), for 0 < E <= E*"
- [, E2(E, T), for E* <
+ -
where E denotes excercise, E* is somethreshold
level of exercise and T is time. Finally, diet (D)
is also important:
~’’
~ co
t
+
+ ~ +.
+ ++
.,,.* "" ,.
~++
+
’V.~
;..~
t ,"
,., ," :’--’;’%-,_,.
......
,, ~--,
++.~,.~’~;.,~- I.T :\i
+
7 ~,
+
°I
¯ +
o
+
+
.."*+
"I
+
,,
(3)
BG= D(D, T)
+
+
The measured level of BGat any period of time is just the sumof all the identifiable
impacts of the events represented by equations
(1) - (3). That is, the summationover all previous events up to somepredetermined cutoff
time becomes:
Anexampleof this kind of computation is
shownin Figure 3., wherefor this particular
patient, only two of the three types of ID were
administered. The top panel shows the measurements of BGbefore supper (denoted by code
62 in the dataset) along with a smoothof these
data. The bottom panel showsthe effective
amountsof dosages (whengreater than zero)
computedfor each measurementin the top
panel.
(4)
BG --
~.H(I,T,F)
+ ~.EI(E,T ) +
E E2(E,T) + % D(D,T).
Equation (4) can only be implementedif it
determined what the relationship between BG
and T might look like for the four functions: H,
El, E2 and D. It is expected that the literature
and someof the other AI-Medparticipants will
be helpful in this regard. For example, it might
turn out that a two parameter Gamma
distribution might describe the phenomenonquite well.
Bivariate scatter diagrams of these data
are shownin Figure 4. For this particular patient, and basedon the slopes of the locally
weightedleast squares lines, it appears that the
relationship between IDE and BGis quite weak.
Note that there are somedatapoints
that appear to contain errors. Consequently,
these data will have to be filtered before the
constructs in (4) are computed.
Figure 4: Effective Dose versus BG
167
AI-MedAbstract
February5, 1994
more,it mightwell be that two or moreof the
predictive methodologiescan be combinedin
someoptimalwayto provide evenbetter forecasts. Finally, onemightwantto use a rulebasedexpert systemto examinethe patient’s
history, the predicted values for BGand makea
determinationas to what should be done. This
last step, however,is beyondthe scopeof the
current paper.
KnowledgeDiscovery
Thestatistical modelswill be developed in S-Plus. A gooddeal of computingand
graphicalanalysisis usedin order to assess the
appropriatemodels.Thestatistical approach
will be oneof fitting GeneralizedAdditive
Models(GAM)
to these data, whichallows
somenonparametricsmoothingto be done during estimation. Importantinteractions between
these variables will also be examined.
References
Twoinduction techniqueswill also be
usedto learn fromthese data. Thefirst is the
tree basedregressioncapability in S-Plus. The
secondis a related approach,called C4.5, which
in turn is built on ID3(bothdueto Quinlan).
Finally, a neural net will be trained onthese
data.
In all cases, a cross validationapproach
will be used to ensure robustnessand the models will be estimatedwith penalties for complexity in an effort to avoidoverfitting. The
results of these alternative approacheswill be
carefully comparedand contrasted.
Chambers,John M. and Hastie, TrevorJ. (1992)
Statistical Modelsin S. Wadsworth
& Brooks,
Pacific Grove,California.
Cleveland, WilliamS. (1993) Visualizing
Data. Hobart Press, Summit,NewJersey.
James, DavidA. and Pregibon, Daryl. (1992)
"ChronologicalObjects in S". AT&T
Bell
Laboratories, MurrayHill, NewJersey.
Piatetsky-Shapiro, Gregoryand Frawley,William J. (1991) KnowledgeDiscoveryin Databases. The AAAI
Press, MenloPark, California.
Implementation
Quinlan, J. Ross (1993) C4.5: Programsfor
MachineLearning. MorganKaufmann,San
Mateo,California.
Whenimplemented,the predicted values of BGcan be used to determinewhetheror
not the patient’s BGis likely to remainin the
desiredrange. Notethat a statistical modelpossesses an importantadvantagehere in that it can
also generatea probabilitydistribution around
the forecast, whichis quite important.Further-
Ramelhart,DavidE., McClelland,JamesL. and
the PDPResearchGroup(1988). Parallel Distributed Processing:Explorationsin the Microstructure of Cognition,volume1 and 2. The
MITPress, Cambridge,Mass.
168

